
Following on from Monday’s chat around diversifying your commodities trading, we today head back to the mainstream with another look at Oil.
While the commodity isn’t as left field as XAU/AUD, the higher time frame resistance level in Oil that we identified back at the start of the month is back in play and worth another look.
First up as always, we take a look at the higher time frame chart. Here we highlight the major resistance level that we spoke about in that last post I’ve linked to above.
Oil Weekly:
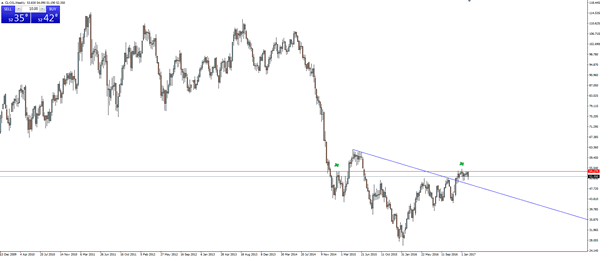
As we said back then, the weekly shows a trend line break and price capped by a horizontal resistance level that price has rejected off in the past. With the level still holding, it may give an opportunity for us to start to look for a short entry.
Once again as always, we then step down to an intraday chart and look for a short term level that offers us tight risk:reward.
Oil Hourly:
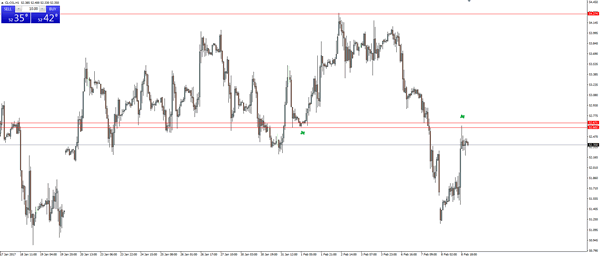
Zooming into the hourly chart, we have seen the first sign of a short term pullback. Price broke the immediately last swing lows, showing that the sellers are gaining a stranglehold on the market.
Oh and look at that. The pullback has magically seen price spike into the previous level of support now turned resistance!
Remember that price still has a bit of room to move higher and still see the higher time frame level hold, so I don’t know if this is the type of setup to be aggressively shorting, but the levels are definitely in play.


