
Key Highlights
- Crude oil price stated a fresh upside wave from the $63.50 support area against the US dollar.
- There was a break above a key bearish trend line with resistance at $66.00 on the 4-hours chart of XTI/USD.
- The US S&P/Case-Shiller Home Price Indices in April 2018 increased 6.6%, less than the forecast of 6.8%.
- Today in the US, the Pending Home Sales for May 2018 will be released, which is forecasted to increase by 0.5% (MoM).
Crude Oil Price Technical Analysis
After trading below the $65.00 support, crude oil price found buyers around $63.50 against the US Dollar. The price traded as low as $63.58 and later it started an upside correction.
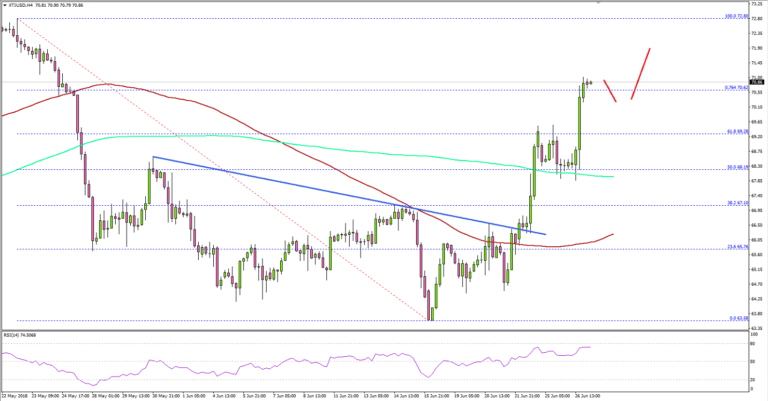
Looking at the 4-hours chart of XTI/USD, the price moved above the $65.00 resistance and broke the 23.6% Fib retracement level of the last decline from the $72.80 high to $63.58 low.
More importantly, there was a break above a key bearish trend line with resistance at $66.00 on the 4-hours chart of XTI/USD. The price climbed above the $68.00 level and the 100 (red) and 200 (green) simple moving averages (4-hours).
However, the upside move was slightly capped by the 76.4% Fib retracement level of the last decline from the $72.80 high to $63.58 low. The price is currently consolidating above the $70.00 support.
On the upside, the price must break the $72.00 resistance to gain traction. Above $72.00, the price may revisit the $75.00 zone. A failure to climb above $71.00 and $72.00 may perhaps result in a bearish reaction back towards $68.00.
Recently in the US, the S&P/Case-Shiller Home Price Indices figure for April 2018 was released by the Standard & Poor’s. The market was looking for a rise of 6.8% in April 2018 compared with the same month a year ago.
However, the actual result was below the market forecast since there was a change of 6.6%. Moreover, the last reading was revised down from 6.8% to 6.7%. There was no major impact on the US Dollar, but pairs like EUR/USD and GBP/USD still remains supported on the downside.
Economic Releases to Watch Today
- US Durable Goods Orders for May 2018 – Forecast -1.0% versus -1.6% previous.
- US Pending Home Sales for May 2018 (MoM) – Forecast +0.5%, versus -1.3% previous.
- US Wholesale Inventories for May 2018 (preliminary) – Forecast +0.2%, versus +0.1% previous.


