
Week
The DAX30 stock index made a strong bearish fall this week but price is now approaching a key support zone.
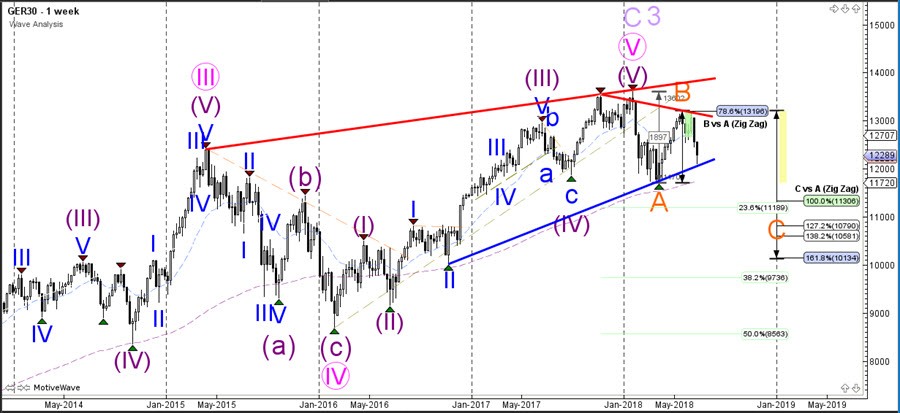
A bearish break below the support trend line could confirm the continuation of the bearish C (orange) and the start of a larger bearish correction.
Day
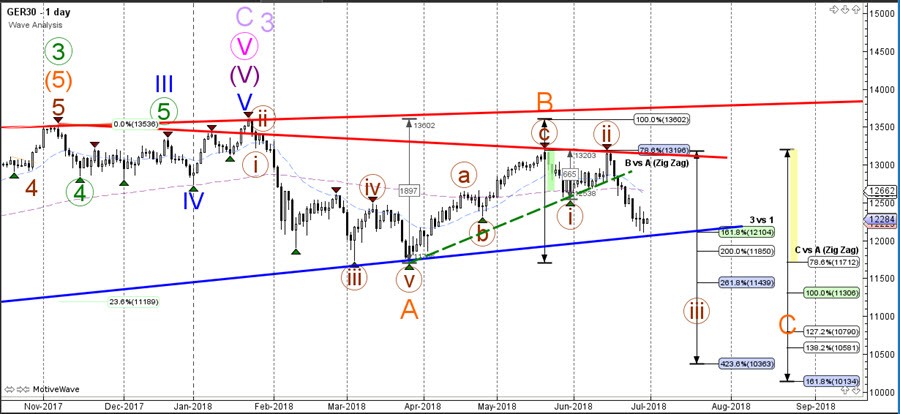
The DAX bounced at the 78.6% Fibonacci resistance level of wave B (orange). The current momentum is probably a bearish wave 3 (dark red) but price will need to break below the support trend line (blue) otherwise an ABC wave pattern and triangle chart pattern is possible too. A bearish breakout could see price move towards Fib targets.
Day2
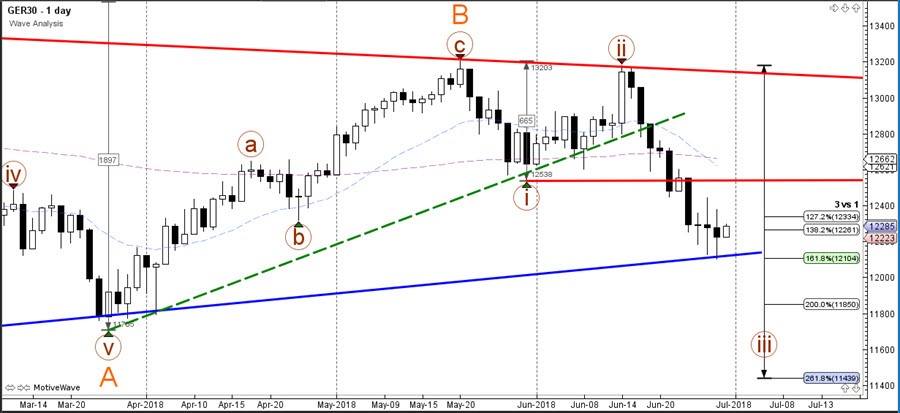
This image shows a zoomed in version of the daily chart. The past several days showed a big fight between bulls and bears as the last two daily candles had big wicks on both the tops and bottoms. A break above the bottom of wave 1 (red) would invalidate the wave 1 and indicate a larger corrective pattern. A bearish break below the wicks could indicate a wave 3 continuation.


