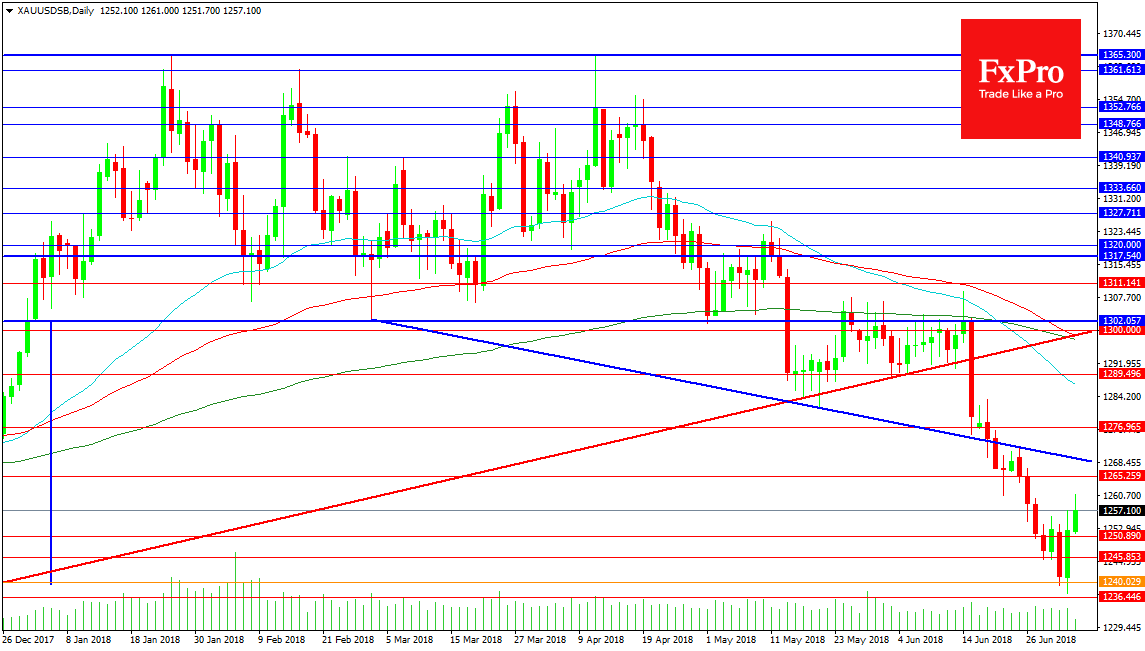
The gold chart has played out as a double top with a break under 1300.00 signalling a move down to 1240.00 from its highs at 1365.00. We have now hit the 1240.00 target area and some profits have been taken here with buyers stepping in to drive price higher. With 1240.00 broken support was found at 1236.45 and price moved back higher. Further support can be seen at 1229.40. Below this area a drop to 1200.00 could be forecasted with 1204.50 on the way as satellite support.
Resistance above the current level comes in at 1265.25 with the descending blue trend line at 1268.50. A break out higher would give long traders a chance to enter or add to their positions provided 1276.95 is cleared. At this point 1300.00 becomes a target with 1289.45 and the 50 DMA at 1287.08 providing resistance. The rising red trend line has reached 1300.00 adding support to the level and can provide additional interest at that point. The 200 DMA is sitting on 1297.76 and the move under this MA by the 50 DMA provided a death cross for the chart a couple of weeks ago. The 100 DMA at 1298.60 is in danger of following suit.