The Pound Sterling has been trading in a medium-term triangle formation pattern against the New Zealand Dollar since the end of April. The currency pair tested its upper boundary on April 27 and reached the bottom border last June.
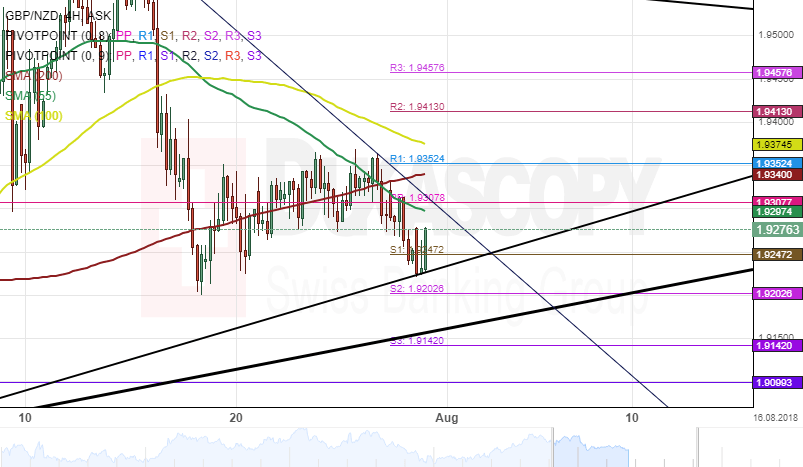
During the past few weeks, the exchange rate has been moving sideways along the 200-hour simple moving average.
Technical indicators on both the 4H and daily time-frame favour bearish sentiment. This might indicate that the GBP/NZD is likely to continue moving south for a potential target at the lower boundary of the triangle pattern during the following trading sessions