
Key Highlights
- The US Dollar found support near the 110.50-70 zone against the Japanese Yen.
- There is a crucial bearish trend line forming with resistance at 111.25 on the 4-hours chart of USD/JPY.
- The US Initial Jobless Claims for the week ending August 04, 2018 declined from 219K to 213K.
- The US Consumer Price Index for July 2018 will be released today, which is forecasted to increase 0.2%.
USDJPY Technical Analysis
The US Dollar declined this week and broke the 111.40 support area against the Japanese Yen. However, the USD/JPY pair is still holding an important support area near 110.50-70.
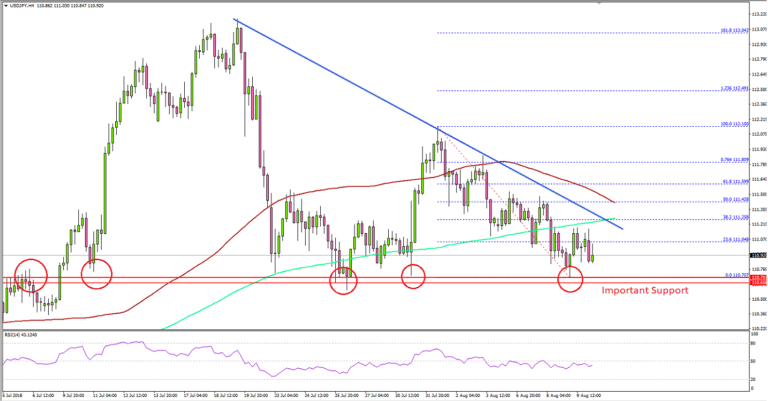
Looking at the 4-hours chart, the pair fell from well above the 111.50 level and followed a bearish path. It settled below the 111.20 support and the 100 simple moving average (4-hour, red).
It even traded below the 111.00 level, but the downside move found support near the 110.50-70 zone. The pair recovered and moved above the 23.6% Fib retracement level of the last decline from the 112.15 high to 110.70 low.
However, upsides were capped by the 111.10-20 zone. Moreover, there is a crucial bearish trend line forming with resistance at 111.25 on the same chart. A break above the trend line is needed for a push towards the 50% Fib retracement level of the last decline from the 112.15 high to 110.70 low at 111.42.
On the flip side, if there is a break and close below 110.50, the pair could decline sharply towards the 110.00 level in the near term.
Fundamentally, the US Initial Jobless Claims report for the week ending August 04, 2018 was released by the US Department of Labor. The market was looking for a rise from the last reading of 218K to 220K.
However, the result was positive as there was a decline in the Initial Jobless Claims to 213K from the last revised reading of 219K.
The report added that:
The 4-week moving average was 214,250, a decrease of 500 from the previous week’s revised average. The previous week’s average was revised up by 250 from 214,500 to 214,750.
Overall, the US Dollar remains supported versus the Japanese Yen. However, today’s CPI release (July 2018) could trigger moves in pairs like EUR/USD, GBP/USD, USD/JPY and AUD/USD in the short term.
Economic Releases to Watch Today
- UK GDP for Q2 2018 (Preliminary) – Forecast +0.4% (QoQ) versus +0.2% previous.
- UK Industrial Production for June 2018 (MoM) – Forecast +0.4%, versus -0.4% previous.
- UK Manufacturing Production for June 2018 (MoM) – Forecast +0.7%, versus +0.8% previous.
- US Consumer Price Index July 2018 (MoM) – Forecast +0.2%, versus +0.1% previous.
- US Consumer Price Index July 2018 (YoY) – Forecast +3.0%, versus +2.9% previous.
- US Consumer Price Index Ex Food & Energy July 2018 (YoY) – Forecast +2.3%, versus +2.3% previous.
- Canada’s employment Change payrolls July 2018 – Forecast 17.0K, versus 31.8K previous.
- Canada’s Unemployment Rate July 2018 – Forecast 5.9%, versus 6.0% previous.


