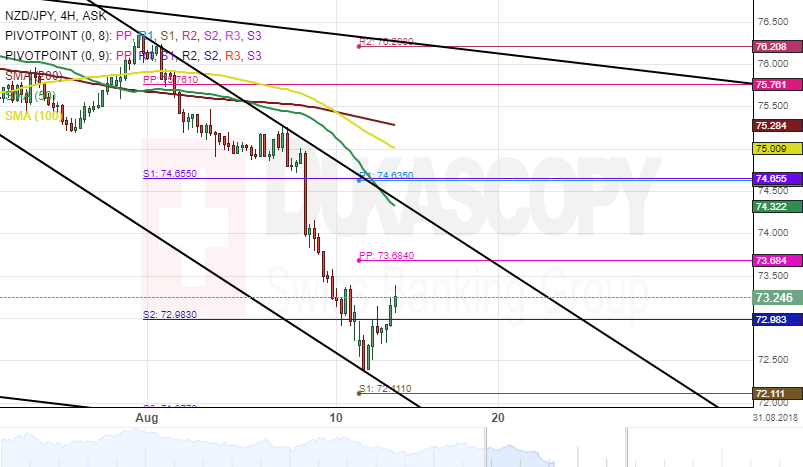
The New Zealand Dollar has been weakening its position against the Japanese Yen since the end of July. This depreciation started when the pair reversed from the upper boundary of a descending channel. As a result, the Kiwi has been trading in a junior descending channel since the beginning of August.
Bears momentum were stable during the past few weeks and thus pushing the currency pair to a two-year low level at the 72.30 mark.
Technical indicators on the daily time-frame suggest that the bearish sentiment is likely to continue during the following trading sessions. The nearest barrier that could hinder the bearish momentum is at 72.11 formed by the weekly PP.