EUR/USD
The EUR/USD is building a potential bullish pullback after a strong bearish breakout. The price could be in a wave 3 (purple), as long as the price does not make a very deep pullback that goes above the resistance zone at 1.15-1.1525.
Daily chart:
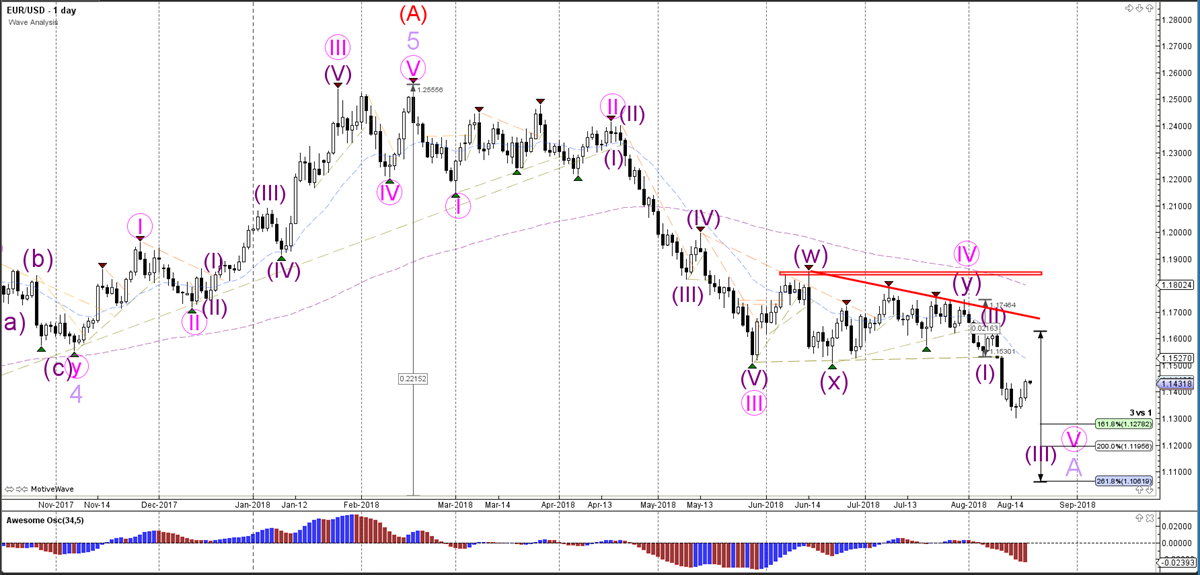
The EUR/USD seems to be building a bearish ABC (purple) correction within wave B (red).
Weekly chart:
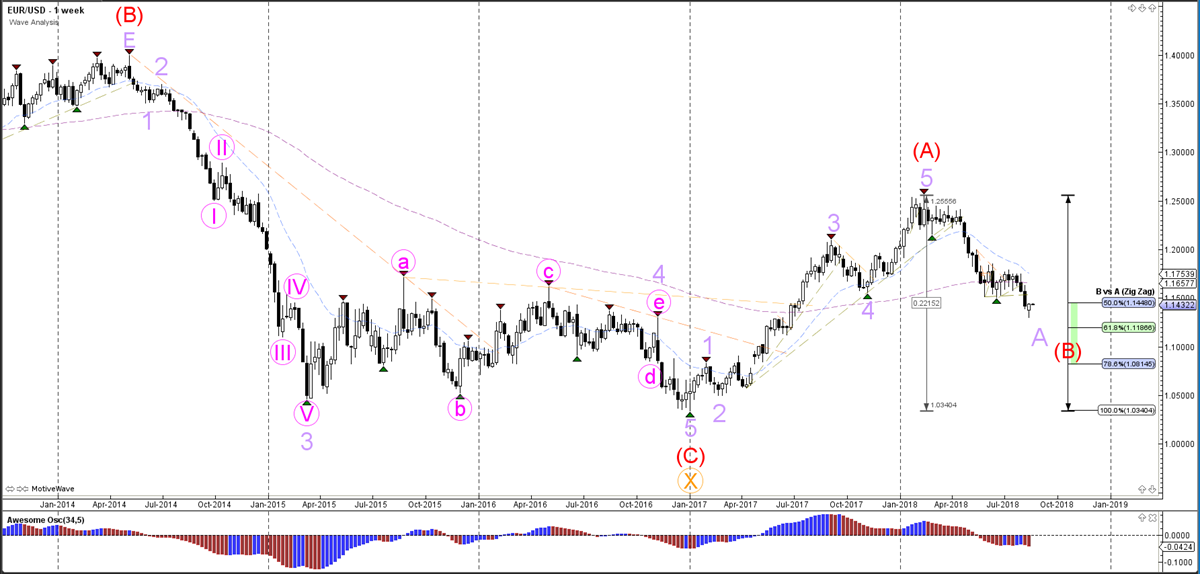
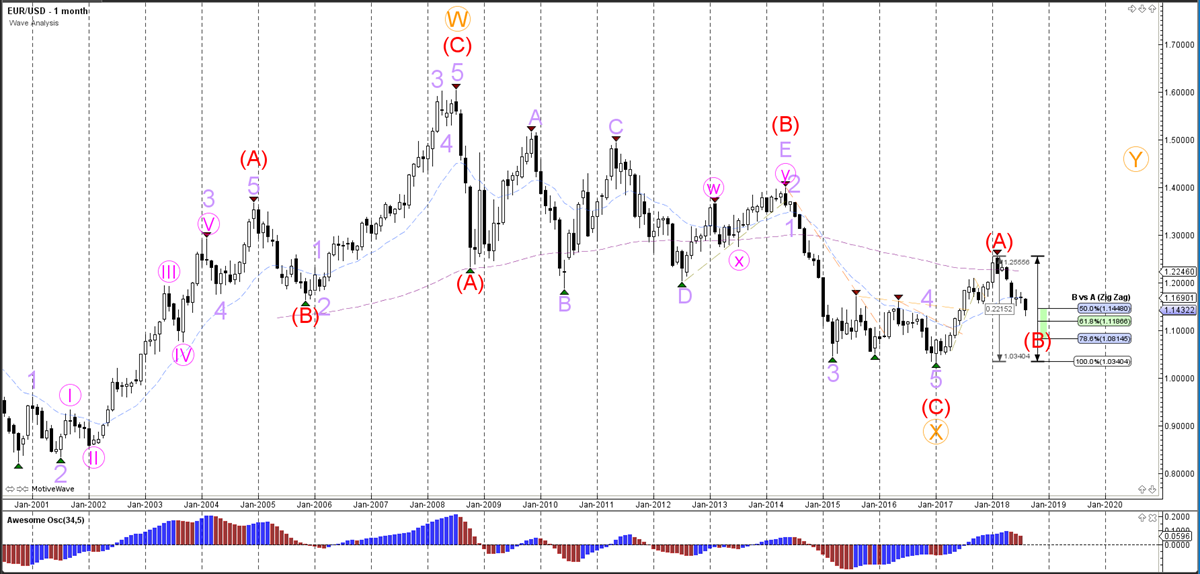
The EUR/USD has completed wave A (red), and the price is most likely retracing to the Fibonacci levels of wave B (red).
Monthly chart:
GBP/USD
The GBP/USD bearish momentum is strong and seems to be building a wave 3 (purple).
Daily chart:
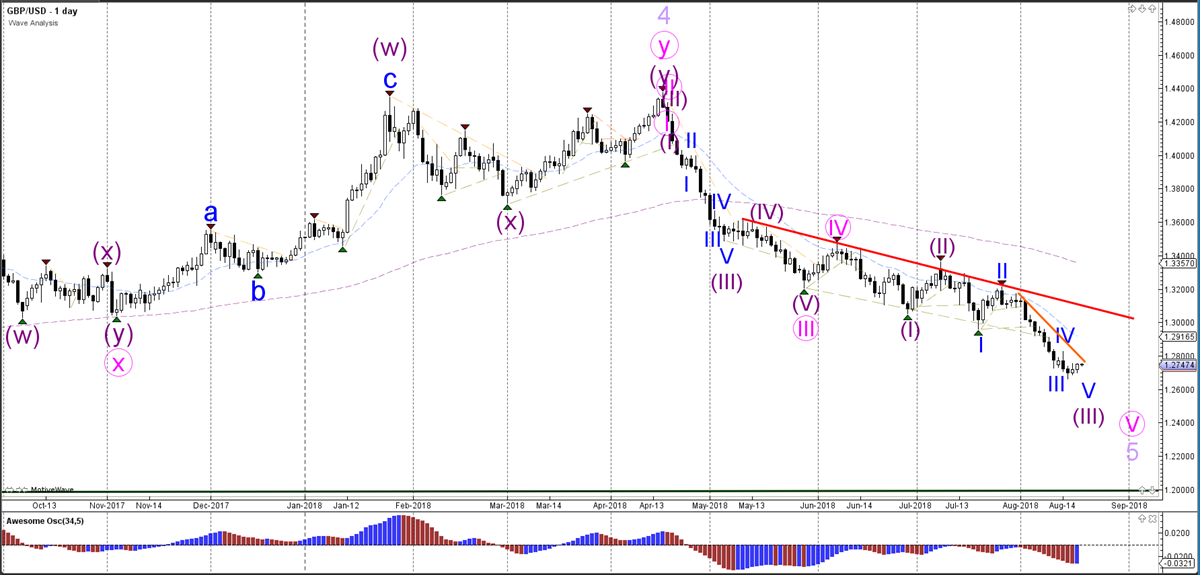
The GBP/USD has probably started the bearish wave 5 after the price has completed a wave 4 (light purple) correction.
Weekly chart:
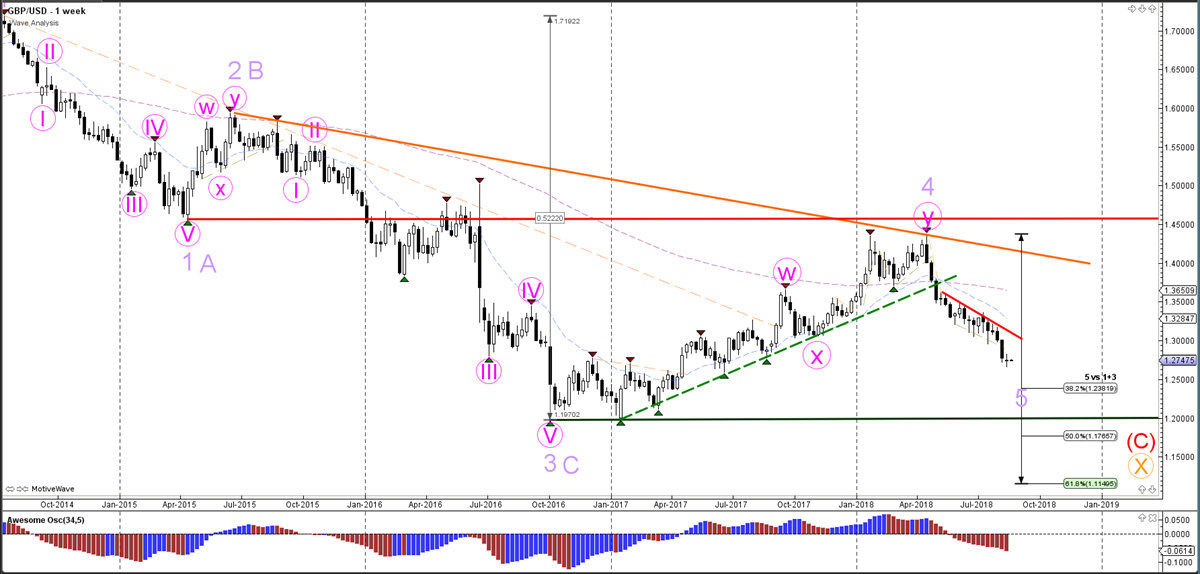
The GBP/USD bearish breakout is probably indicating the start of wave 5 (purple), whereas a bullish break above resistance (red) indicates that a different wave pattern is valid.
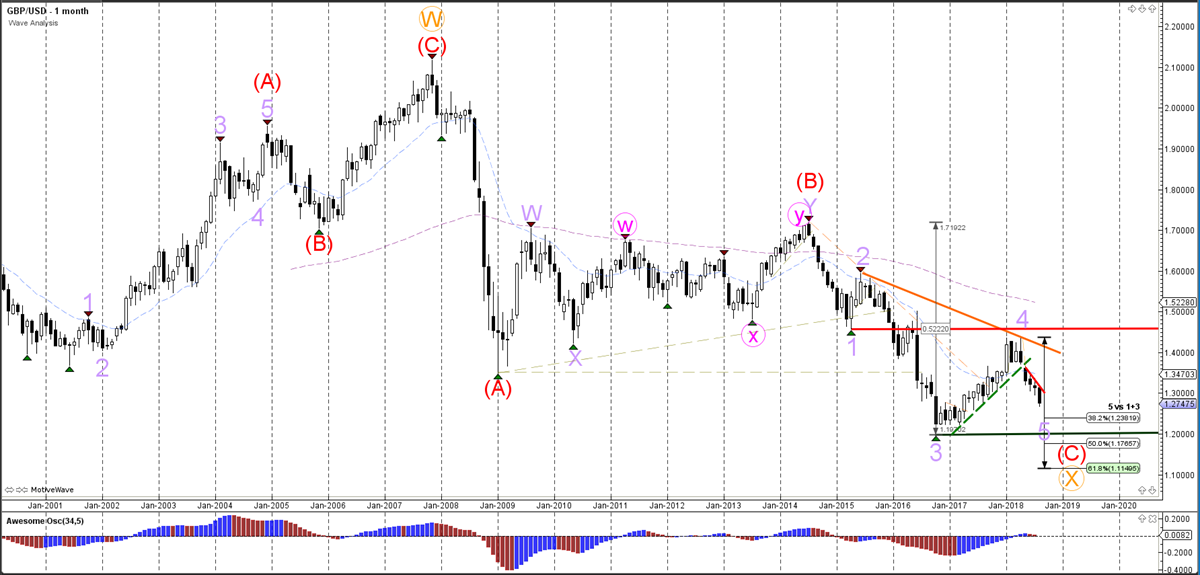
Monthly chart:
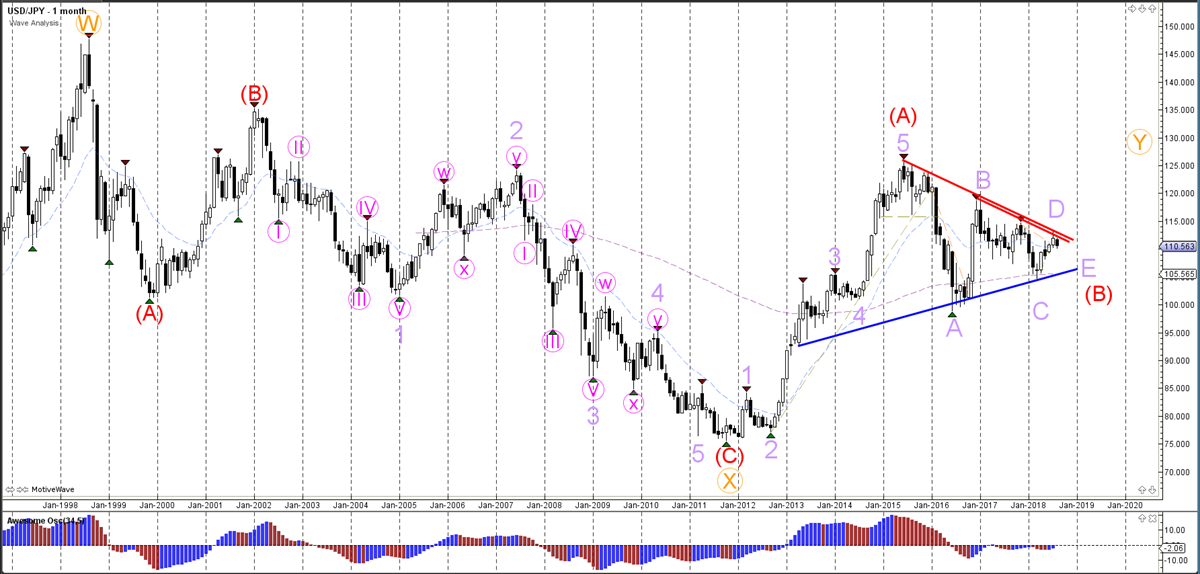
USD/JPY
The USD/JPY broke below the support trend line (dotted blue) which is probably part of a bearish WXY (pink) within the final leg wave E (light purple) of the triangle pattern.
Daily chart:
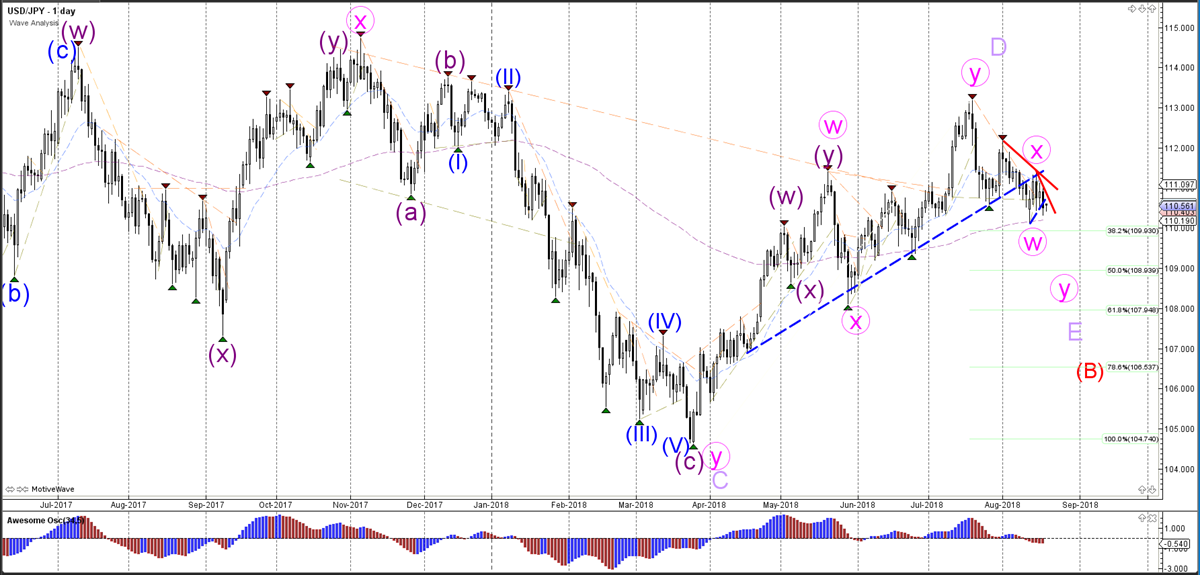
The USD/JPY could be building an ABCDE triangle (light purple) within wave B (red).
Weekly chart:
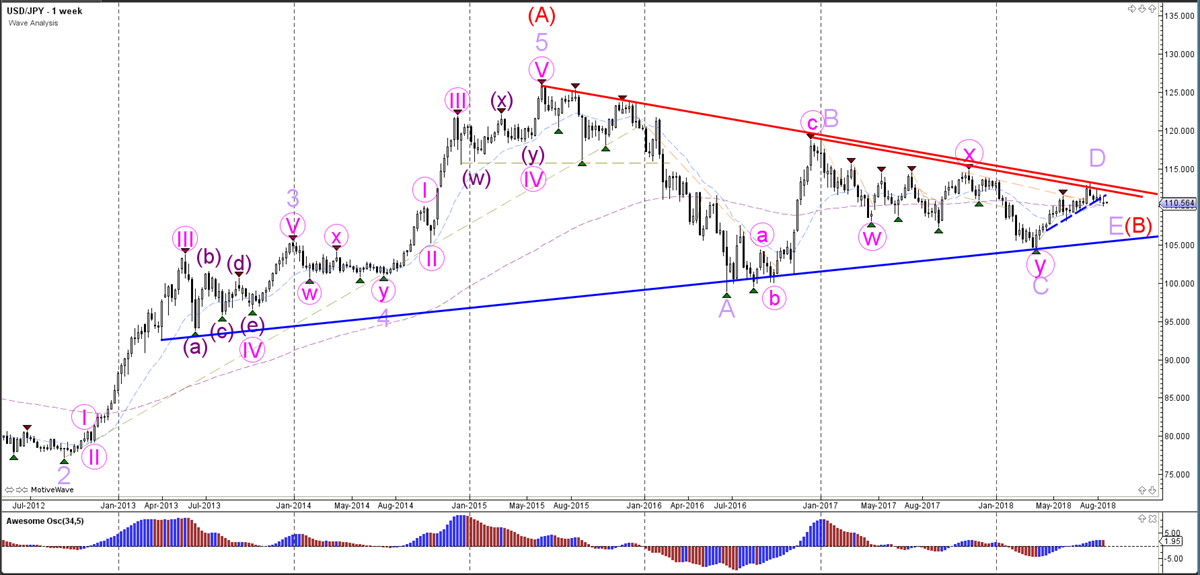
The USD/JPY is in the wave E (light purple) of the triangle pattern.
Monthly chart: