EUR/USD
The EUR/USD pair closed the day flat around 1.0900 in a choppy start to the week. Trading was limited as European markets were closed due to Labor Day, with low volumes extending all through the day. Macroeconomic developments didn’t look good for the greenback, as according to official releases, personal income rose by 0.2% in March, missing expectations of 0.3%, while personal spending remained flat, against market’s forecast of a 0.2% advance. The same report also showed that inflation slowed, as core PCE price index fell by 0.2% when compared to February, while the year-on-year reading surged by 1.8%, below previous 2.1%. Also, the final Markit manufacturing PMI for April was confirmed at 52.8, while the ISM manufacturing PMI came in at 54.8, below March’s 57.2. Despite data were still compatible with growth, the US economic activity seems to have peaked late 2016, with growth decelerating. Also, US Treasury Secretary Steve Mnuchin said that it could take up to two years to have economic growth reach 3%, pouring some further cold water over hopes of a hawkish Fed this week.
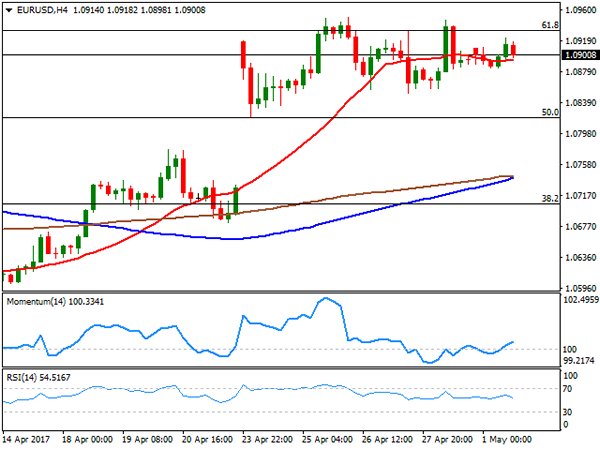
From a technical point of view, the pair has made little progress, still stuck around 1.0900 and confined within the 1.0820/1.0950 range set last week. The bullish potential, however, remains firm in the background, although cautious trading will likely persists. The pair enters the Asian session with the 4 hours chart showing that the price keeps hovering around a horizontal 20 SMA, whilst technical indicators diverge from each other, but both stand around their mid-lines, maintaining the short term perspective neutral. The pair needs to accelerate beyond 1.0950 to be able to extend its rally pass 1.1000, with further soft US data exacerbating demand for the common currency.
Support levels: 1.0855 1.0820 1.0785
Resistance levels: 1.0950 1.1000 1.1045
USD/JPY
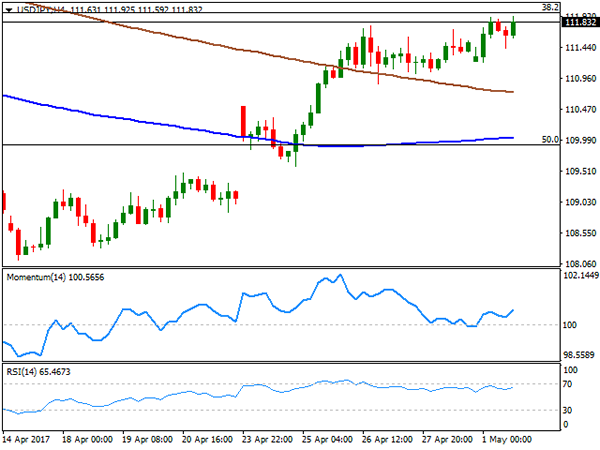
The USD/JPY pair advanced to a fresh 1-month high of 111.92, and closed the day not far below it, as despite US data released this Monday missed expectations, US stocks edged higher alongside with US Treasury yields. The 10-year note yield surged to 2.33% from previous 2.28%, while the 30-year note benchmark peaked at 3.01% after closing last week at 2.95%. The Bank of Japan will release the minutes of its latest meeting during the upcoming Asian session, with Governor Kuroda expected to offer a speech alongside. Despite surpassing April high by a handful of pips, the pair remains contained by a major resistance at 112.00, the 38.2% retracement of the November/December rally. The 4 hours chart shows that the price advanced further above its 100 and 200 SMAs, with the shortest slowly turning higher, but well below the largest one, and technical indicators heading higher within positive territory, supporting additional advances on a break above the mentioned Fibonacci resistance, as the movement will likely trigger some short stops, favoring an advance up to the 112.90 region.
Support levels: 111.60 111.20 110.95
Resistance levels: 112.00 112.45 112.90
GBP/USD
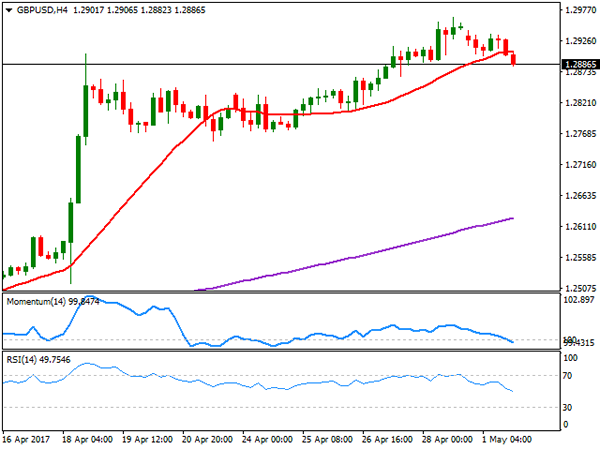
The GBP/USD pair closed the day marginally lower, breaking below 1.2900 with US closing bell and settling around 1.2880. There was no particular reason behind Cable’s slide, but it could be attributed to further profit taking after the pair neared the critical 1.3000 threshold. Pound’s upcoming direction will likely be linked to the different UK PMIs to be release later this week, starting on Tuesday with the Markit Manufacturing one, as macroeconomic data has been easing from its post-Brexit peaks, putting back on tap the possibility of economic slowdown. From a technical point of view, the pair is gaining downward potential short term, given that in the 4 hours chart, the price retreated towards a bullish 20 SMA, whilst technical indicators head north within positive territory, suggesting a bearish corrective move rather than confirming an interim top. The pair is now poised to correct lower, buy bulls will likely take their chances on dips towards 1.2830. A decline down to 1.2750/70 will be seen as corrective, as only below this last the movement will become more sustainable, with investors then eyeing 1.2500. Still and with the ongoing dollar’s weakness, chances of such decline are well limited for this week, unless UK data disappoint big and the US Fed surprises with an extremely hawkish stance.
Support levels: 1.2830 1.2795 1.2745
Resistance levels: 1.2910 1.2965 1.3000
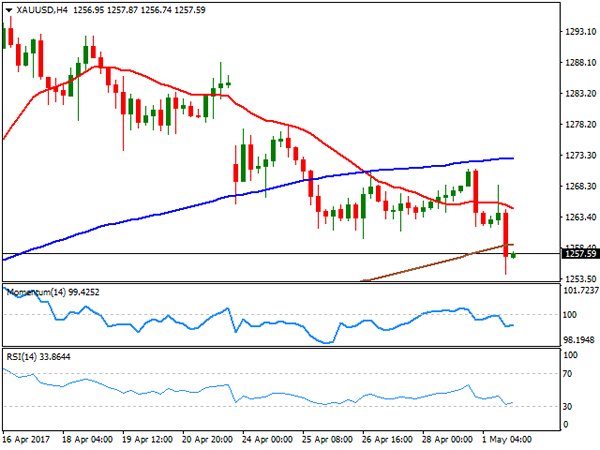
GOLD
The GBP/USD pair closed the day marginally lower, breaking below 1.2900 with US closing bell and settling around 1.2880. There was no particular reason behind Cable’s slide, but it could be attributed to further profit taking after the pair neared the critical 1.3000 threshold. Pound’s upcoming direction will likely be linked to the different UK PMIs to be release later this week, starting on Tuesday with the Markit Manufacturing one, as macroeconomic data has been easing from its post-Brexit peaks, putting back on tap the possibility of economic slowdown. From a technical point of view, the pair is gaining downward potential short term, given that in the 4 hours chart, the price retreated towards a bullish 20 SMA, whilst technical indicators head north within positive territory, suggesting a bearish corrective move rather than confirming an interim top. The pair is now poised to correct lower, buy bulls will likely take their chances on dips towards 1.2830. A decline down to 1.2750/70 will be seen as corrective, as only below this last the movement will become more sustainable, with investors then eyeing 1.2500. Still and with the ongoing dollar’s weakness, chances of such decline are well limited for this week, unless UK data disappoint big and the US Fed surprises with an extremely hawkish stance.
Support levels: 1.2830 1.2795 1.2745
Resistance levels: 1.2910 1.2965 1.3000
WTI CRUDE OIL
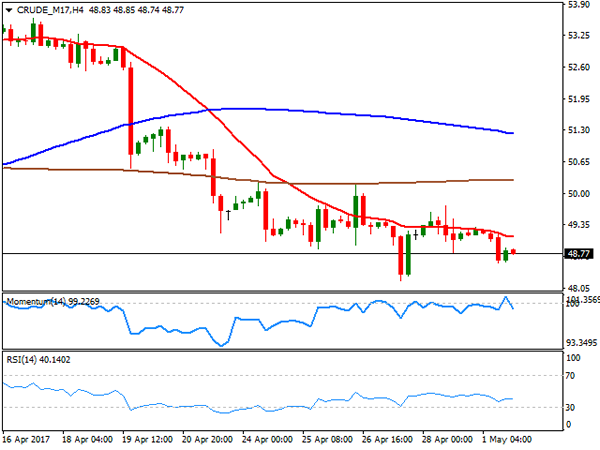
Crude oil prices slipped within range at the beginning of the week, with West Texas Intermediate crude futures settling around $48.80 a barrel. Poor Chinese PMI figures, indicating the possibility of diminishing demand for the commodity, added to concerns triggered by rising US production. WTI closed at its lowest in over a month, and is poised to extend its decline according to technical readings, given that in the daily chart, it held below all of its moving averages, whilst technical indicators have turned lower after a period of consolidation near oversold levels. In the shorter term, and according to the 4 hours chart, the risk is also towards the downside, with a bearish 20 SMA containing advances, the Momentum indicator hovering within neutral territory and the RSI regaining its downward strength around 39. Last week low of 48.20 is a critical support, with a break below it favoring a downward extension towards the 45.00 region.
Support levels: 48.20 47.70 47.10
Resistance levels: 49.00 49.60 50.20
DJIA
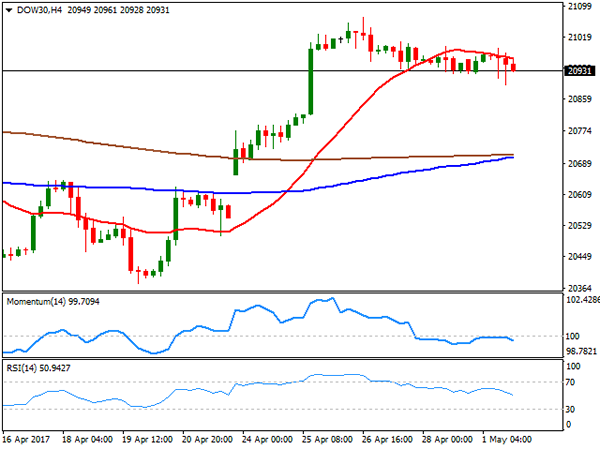
Having traded within positive territory for most of the day, US equities closed the day mixed, with the Dow Jones Industrial Average down 26 points to 20,914.42 and the S&P up 0.17% to settle at 2,388.33. The Nasdaq Composite jumped 44 points to 6,091.60, led by an advance in Twitter that soared 6% on live news streaming deal with Bloomberg. Among the Dow, technology-related equities were the best performers, with Apple up 2.26%, followed by Microsoft which added 1.37%. Boeing was the worst performer, shedding 1.21%. The daily chart for the index indicates that the index remains towards the upside, as it held above a modestly bullish 20 DMA, whilst technical indicators turned back north near overbought readings. In the 4 hours chart, however, the upside remains limited by a bearish 20 SMA, whilst the Momentum indicator turned south after failing to overcome its mid-line and the RSI heads lower around 52. The intraday high was settle at 20,989, the level to surpass to see it regaining some bullish traction this Tuesday.
Support levels: 20,913 20,869 20,819
Resistance levels: 20,989 21,035 21,071
FTSE100
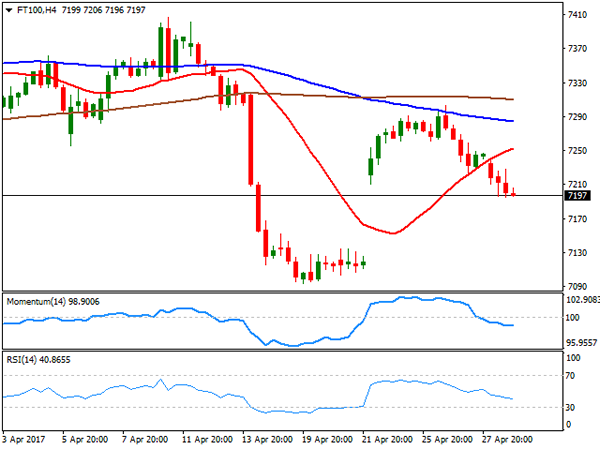
London market was closed this Monday due to Labor day, with the FTSE 100 latest registered close at 7,203.94. The ongoing Pound’s weakness could favor a recovery in the benchmark this Tuesday, although it will also depend on how Asian markets develop after the slow start to the week. Technically, the daily chart shows that the index settled below its 100 DMA with the 20 DMA gaining downward strength above the latest and containing advances. Technical indicators in the mentioned chart faltered around their mid-lines mid-week, turning south afterwards and maintaining their bearish momentum. In the 4 hours chart, the index closed the week below all of its moving averages, whilst technical indicators head lower within negative territory, supporting additional declines for the upcoming days.
Support levels: 7,173 7,126 7,081
Resistance levels: 7,228 7,259 7,303
DAX
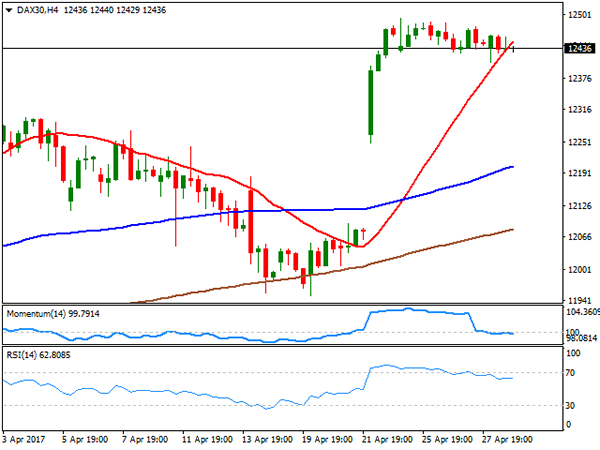
European markets were also closed on holidays at the beginning of the week amid a holiday, with the German’s DAX latest registered close at 12,436. Risk aversion continued easing at the beginning of the week, which suggest that further gains could be expected, despite the downward correction seen at the end of past week. Technically, the daily chart shows that the benchmark has been within a consolidative phase for most of the last few days, but also that the risk remains towards the upside as it holds well above healthy bullish moving averages, whilst indicators hold within positive territory. In the 4 hours chart, the technical outlook is neutral-to-bullish, as the index holds around a sharply bullish 20 SMA, the Momentum turned flat around its 100 level, while the RSI heads nowhere around 62.
Support levels: 12,405 12,366 12,312
Resistance levels: 12,458 12,495 12,530