
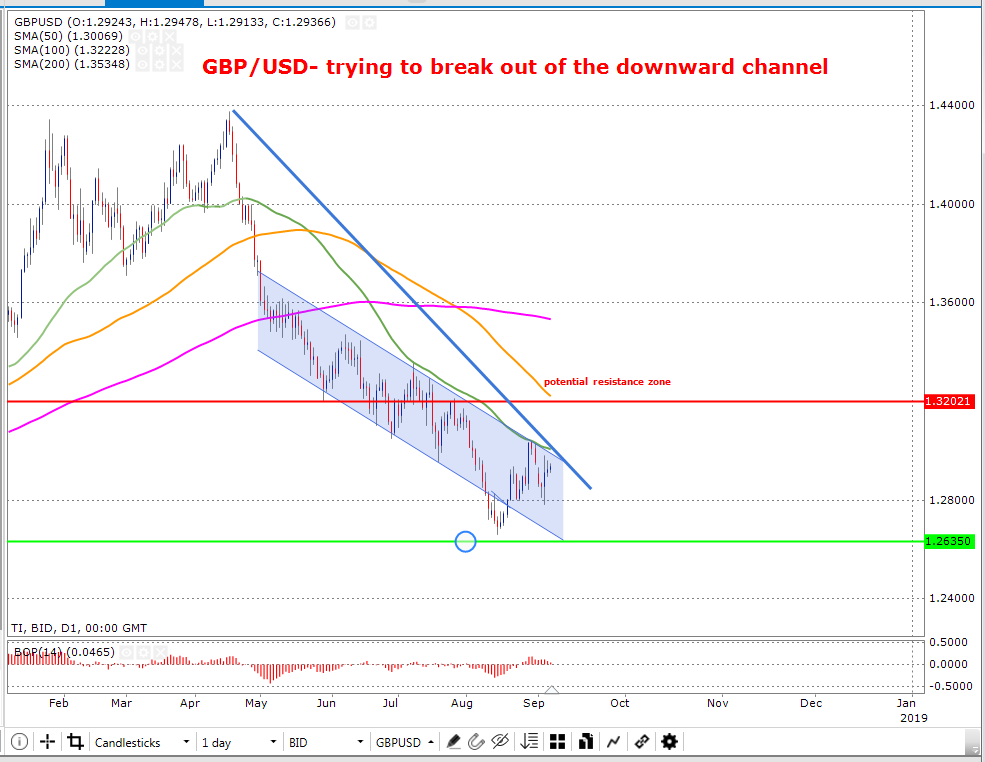
The chart below on a daily time-frame displays evidence that the pair GBP/USD is attempting to break out of the downward channel which is indicated in light blue. Additionally, the price for the pair is still trading below all moving averages where it is fairly close to the support zone (colored in green) which is priced at $1.263.
Furthermore, the price is trading near to the downward trend line (colored in blue) where the 50-day moving average (colored in green) is gradually pivoting to the upside which can maybe be seen as a bullish point. At this point, the possibilities of the price breaking out of the upward trend line to drive towards the resistance zone (colored in red) which is priced at $1.320 are present. However, the price must trade above the 50-day at the least to be considered to move up to resistance.
The Balance of Power chart below shows the bulls losing control and routing into bear territory. If this continues the price trading towards the support zone may happen.
Major support: 1.26350
Major resistance: 1.32021


