EUR/USD
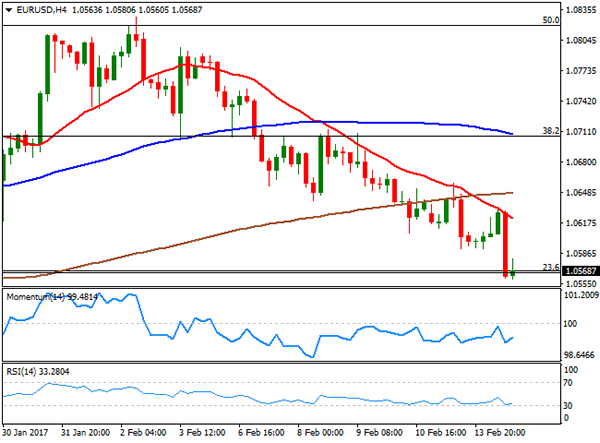
The American dollar got a nice boost from FED’s head Yellen, who reiterated in the Semiannual testimony before the Congress that "waiting too long to remove accommodation would be unwise," putting a March rate hike back on the table. Furthermore, she downplayed the uncertainty on fiscal policy as just one of the factors to take into consideration when deciding a rate hike. The EUR/USD pair fell down to 1.0560, its lowest in over a month, further weighed by soft data coming from the EU earlier in the day. Growth in the area decelerated during the last quarter of 2016, with German Q4 GDP printing 0.4%, below the 0.5% expected, but above a previously revised 0.1%, while for the EU, the preliminary growth estimation printed 0.4%. In the US, the January PPI increased by 0.6% when compared to December, and by 1.6% from a year earlier, beating expectations.
Technically, the EUR/USD pair reached a major support, the 23.6% retracement of the November/January decline, as the pair struggled two weeks around the level before being able to recover further. The ongoing political uncertainty in the EU alongside with soft data in one hand, and in the other rising inflation and a hawkish FED, the fundamentals have aligned with the technical picture in a bearish case for the pair, particularly on a bearish acceleration below the mentioned daily low. Technically, the 4 hours chart shows that a bearish 20 SMA, now around 1.0620 keeps capping the upside, whilst technical indicators have stabilized near oversold readings, as speculative interest has reached its first bearish target and left the price consolidating in a well-limited range below the 1.0590 level.
Support levels: 1.0560 1.0520 1.0470
Resistance levels: 1.0590 1.0625 1.0660
USD/JPY
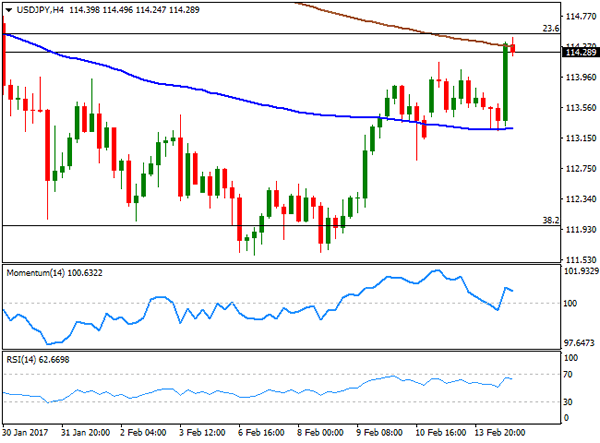
The USD/JPY pair surged to 114.49, its highest since late January, reversing course following Yellen’s hawkish statement before the US Congress. The FED’s head woke up speculation of a March rate hike after saying that "at our upcoming meetings, the committee will evaluate whether employment and inflation are continuing to evolve in line with these expectations, in which case a further adjustment of the federal funds rate would likely be appropriate." The USD/JPY pair traded with a soft tone at the beginning of the day, as risk aversion dominated the Asian session, following news that US President Donald Trump’s national security advisor Michael Flynn quit, over his contacts with Russia, a clear sign of how vulnerable the pair is to any headline coming from the US new administration. The modest tone of worldwide equities is keeping the upside limited, and technically, a major resistance stands a few pips above the mentioned high, at 114.55, the 23.6% retracement of this year bullish run. A break above it could fuel the advance, but technical readings in the 4 hours chart, don’t support the case, as the price is unable to advance beyond a bearish 200 SMA, whilst technical indicators are retreating within positive territory, not enough anyway to confirm a downward move.
Support levels: 113.95 113.40 113.00
Resistance levels: 114.55 114.90 115.40
GBP/USD
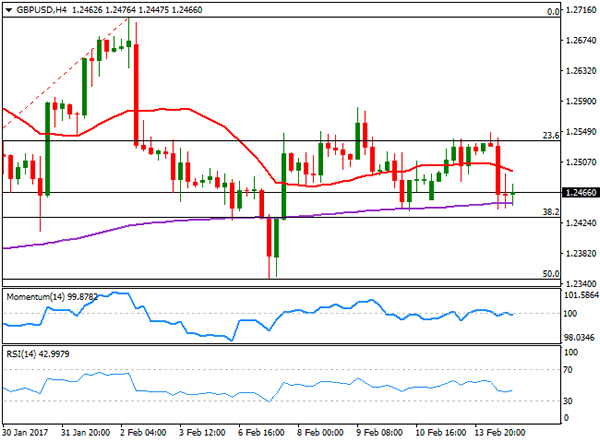
The Pound fell to a daily low of 1.2443, but not because of Yellen’s hawkish stance before the Senate Banking Committee, but because of shockingly highs wholesale inflation figures. In fact, such low was achieved during the London session, with the pair confined to a tight 50 pips range afterwards, with the Sterling still reluctant to give up to dollar’s strength. UK CPI rose 1.8% in January when compared to a year earlier, its highest level in almost three years, even despite the MoM reading came in at -0.5%. Producer price inflation (input prices), meanwhile, surged to 20.5% from a revised previous 17% and well ahead of its 18.5% consensus forecast, due to rising energy costs. Output prices also rose by more-than-expected, but at a slower pace, up by 3.5% YoY from previous 2.8% and against an expected advance of 3.2%. It won’t take long until producers pass rising cost on to consumers, with CPI now seen rising beyond 3.0% during the upcoming months. The big question is how tolerant the BOE will be and for how long. The pair maintains the neutral stance seen on previous updates, although there’s an increasing bearish potential, as in the 4 hours chart, the price is now below a bearish 20 SMA, the Momentum indicator turns lower around its 100 level, whilst the RSI indicator consolidates around 43. The pair has an immediate Fibonacci support at 1.2430 which if broken, can lead to a steady decline down to 1.2346, February low. The pair needs to firm up beyond 1.2540, on the other hand, to gain some bullish traction during the upcoming sessions.
Support levels: 1.2430 1.2390 1.2345
Resistance levels: 1.2500 1.2535 1.2585
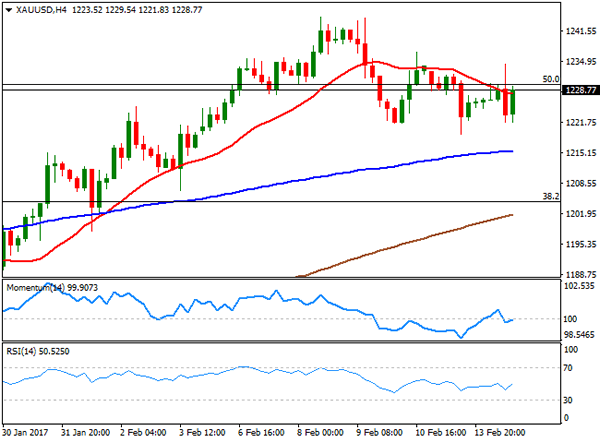
GOLD
An early advance in gold prices was quickly reversed post-Yellen, with the commodity closing the day marginally higher at $1,228.50 a troy ounce. Risk aversion dominated the Asian session, with most local share markets closing in the red, amid Trump’s security advisor resignation. Slackened physical demand from retailers, weighed on the commodity, but it was increasing speculation of an upcoming US rate hike this March what sent the bright metal lower. Technically, the commodity maintains the positive tone seen on previous updates, as the price remained above a bullish 20 DMA, whilst technical indicators turned flat well above their mid-lines, paring the downward correction from overbought conditions seen at the beginning of the week. In the shorter term, and according to the 4 hours chart, technical indicators are hovering around their mid-lines, whilst the price struggles around a bearish 20 SMA. A major Fibonacci resistance stands at 1,230.00, with an upward acceleration beyond it exposing this month high of 1,244.42.
Support levels: 1,221.80 1,210.10 1,200.00
Resistance levels: 1,230.00 1,237.10 1,244.70
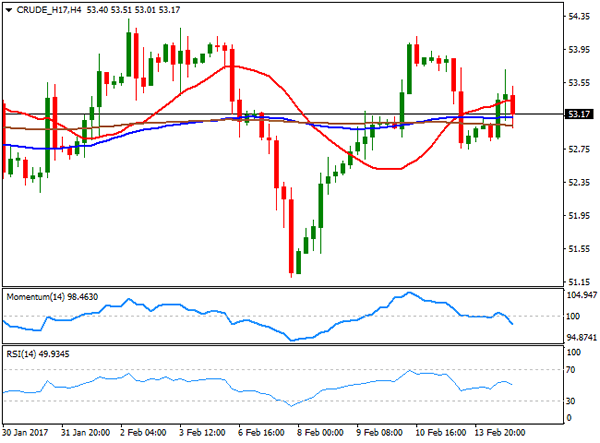
WTI CRUDE
Crude oil prices made little progress this Tuesday, with West Texas Intermediate futures settling at $53.16 a barrel, ahead of US stockpiles reports. Crude advanced at the beginning of the day up to 53.70, but eased on the back of dollar’s strength, still trapped between lingering concerns about rising US production and OPEC’s compliance with its commitment to cut output. Upcoming US data could trigger some sharp moves either side of the board, particularly if stockpiles present another large build. From a technical point of view, the commodity presents a neutral stance in the daily chart, moving back and forth around a horizontal 20 DMA, and with technical indicators heading nowhere around their mid-lines. Shorter term, the 4 hours chart shows that the price remains stuck within a congestion of moving averages, but that technical indicators are entering bearish territory, indicating that the commodity may fall, particularly on a break below 52.60, the immediate support.
Support levels: 52.60 52.00 51.40
Resistance levels: 53.70 54.40 55.20
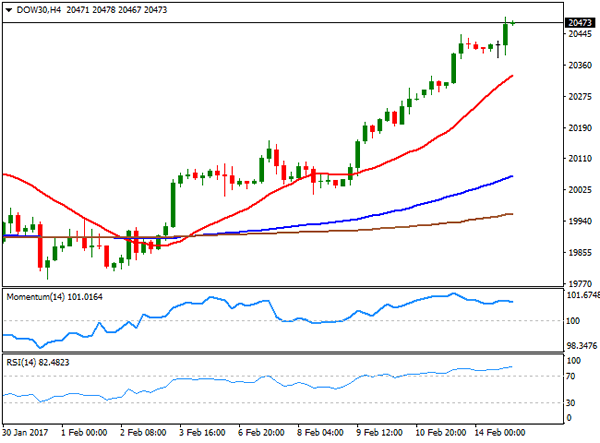
DJIA
US indexes closed at record highs for a fourth consecutive session, with the DJIA reaching a new milestone right ahead of the close, settling at 20,504.27, up by 92 points or 0.45%. The Nasdaq Composite added 18 points and closed at 5,782.57, while the S&P gained 0.40%, to 2,337.58. The banking sectors led the way higher on hopes US President Trump will cut corporate taxes, with JP Morgan Chase leading winners’ list within the Dow, up by 1.71%, and Goldman Sachs up 1.34%, closing at an all-time high. Apple also closed at an all-time high, up daily basis by 1.28%. The DJIA presents a strong bullish tone in the daily chart, as technical indicators keep heading north, although the RSI stands at 79, indicating extreme overbought conditions. Back in December, the indicator reached 86 before correcting lower, which means that current reading is hardly a sign of upward exhaustion. In the 4 hours chart, the index is far above its moving averages, with the 20 SMA heading sharply lower around 20,320, reflecting the buying fever around US equities, whilst technical indicators also head north in extreme overbought territory, with no aims to changing course.
Support levels: 20,489 20,432 20,385
Resistance levels: 20,550 20,600 20,650
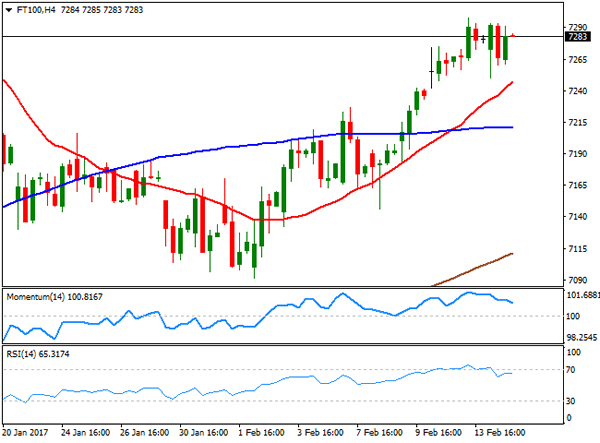
FTSE 100
The FTSE 100 lost 10 points this Tuesday, closing the day at 7,268.58, despite a strong earnings report from TUI, as the travel firm added 5.18%, after the company reported that its first-quarter losses had narrowed. Royal Bank of Scotland was the best performer, up 5.29% as the banking sector benefited from improving sentiment, while Rolls Royce Holding topped losers’ list, down 3.0% after reporting a pre-tax loss of £4.6bn. The index recovered some ground in after-hours trading, maintaining its positive tone in the daily chart, as it’s still holding well above its moving averages, while technical indicators continue consolidating within positive territory. Shorter term, the 4 hours chart shows that the index remains above a bullish 20 SMA, but technical indicators are heading marginally lower, still within positive territory. The Footsie needs to break above 7,298, Monday’s high to gather some upward strength, and advance up to 7,354, the record high posted last January.
Support levels: 7254 7,208 7,163
Resistance levels: 7,298 7,354 7,390
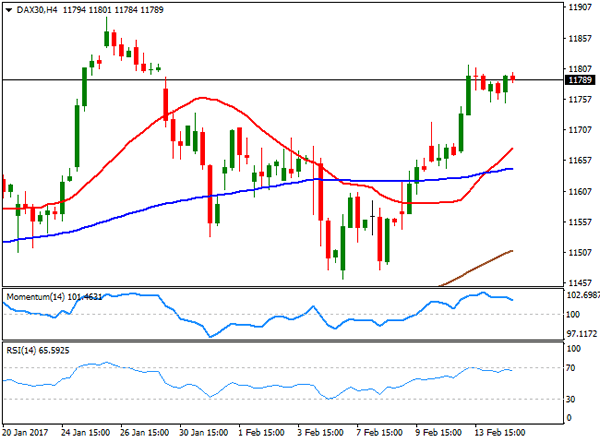
DAX
European equities closed mixed, but not far from their daily opening levels, with the German DAX down 2 points to 11,771.81, on poor local data, as GDP and ZEW sentiment survey disappointed, and a persistent cautious mood ahead of FED’s Yellen testimony. Banks and automakers were the best performers, with Deutsche Bank up 1.77% and Commerzbank adding 1.76%. Volkswagen added 0.94%, but only eight out of thirty components closed in the green. In the daily chart, the index stands at the lower end of its weekly range, still above its 20 DMA and far above a bullish 100 DMA, but technical indicators continue to lack enough strength to confirm an upward extension, with the Momentum still stuck around 100 and the RSI flat around 62. In the 4 hours chart, technical indicators are barely retreating from overbought readings, whilst the 20 SMA maintains its bullish slope above the 100 SMA, both over 100 points below the current level.
Support levels: 11,745 11,694 11,640
Resistance levels: 11,815 11,854 11,891