
The USD/JPY is building a bull flag chart pattern (purple lines). The break of the flag could indicate a bullish push up towards the 78.6% Fibonacci retracement near 112.50.
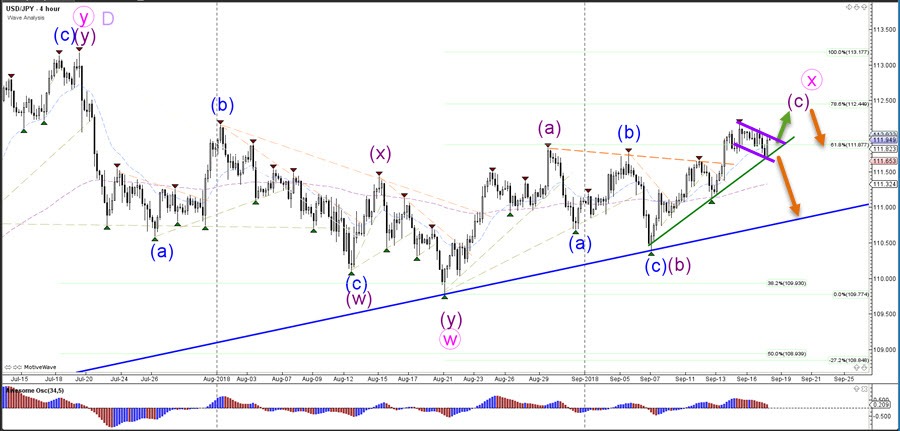
The USD/JPY will either bounce or break the 78.6%Fibonacci retracement levelof wave X (pink).A break makes the wave X less likely whereas a bounce would confirm it

The USD/JPY needs to break above the resistance trend line (orange) before a continuation towards the Fibonacci target becomes more likely. The bull flag pattern remains intact as long as price stays above the support trend line (green) and Fibonacci retracement levels.


