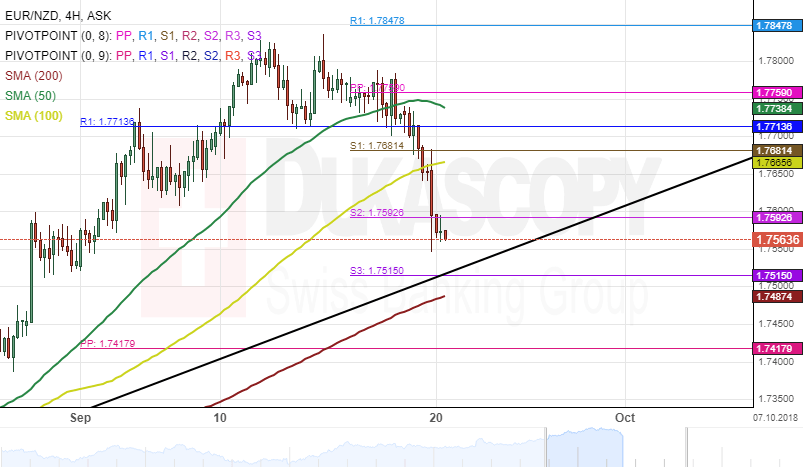
A three-month ascending channel pattern has guided the common European currency higher against the New Zealand Dollar. The currency pair bounced off the lower boundary of the channel on June 14 and had since reached October 2016, high level at 1.7847. Presently, the exchange rate is trading near the lower boundary of the three months ascending channel at 1.7592. From a technical point of view, a support cluster formed by the combination of the weekly pivot point and the 200-hour SMA at 1.7592 could provide significant support for the pair to reverse north and target a resistance level set by the weekly S1 and the 100-hour SMA at 1.7662. However, if this support line is unable to hold, a breakout through the bottom border of the channel pattern is a possibility within this session.