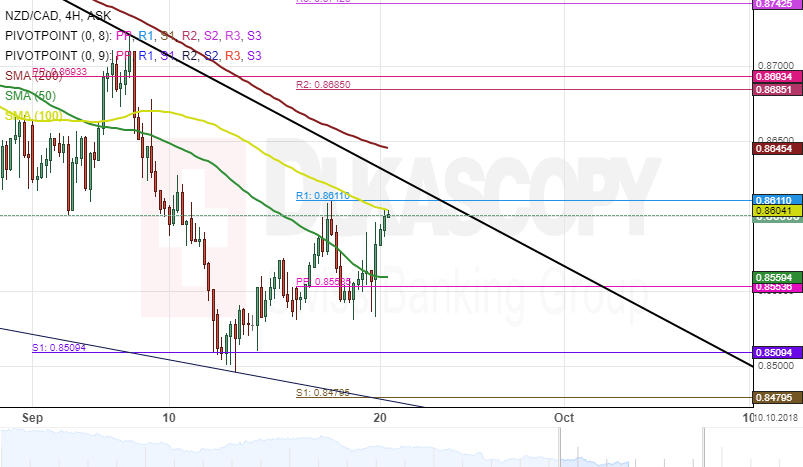
The NZD/CAD currency pair has been trading in a descending channel since mid-June. This descending channel has guided the currency pair toward March 2016 low level at 0.8509. The currency pair reversed from this low level a few days ago. Currently, the rate has breached the 50-hour simple moving average at 0.8559. The next level the exchange rate could target will be a resistance line formed by the 200-hour SMA at 0.8647. Although, a resistance cluster formed by the combination of the weekly and the 100-hour SMA at 0.8611 could hinder the currency exchange rate from hitting this target today.