Thersa May created a lot of uncertainty in the market by saying no deal is better than a bad deal. She has nothing on the table and traders knows about this.
Minutes from the 4 September monetary policy meeting at the Reserve Bank of Australia confirmed that the next move in interest rates is likely to be another hike. Trump is asking OPEC to cut oil prices, and this is going to be the major theme in the oil market. The UK retail sales and inflation beat forecasts despite Brexit uncertainty, and this pushed the sterling higher however the question is if it can sustain its gain. China has imposed 10% tariffs on $60bn American imports in response to US 10% tariffs on 200bn chinses goods.
Technical Analysis
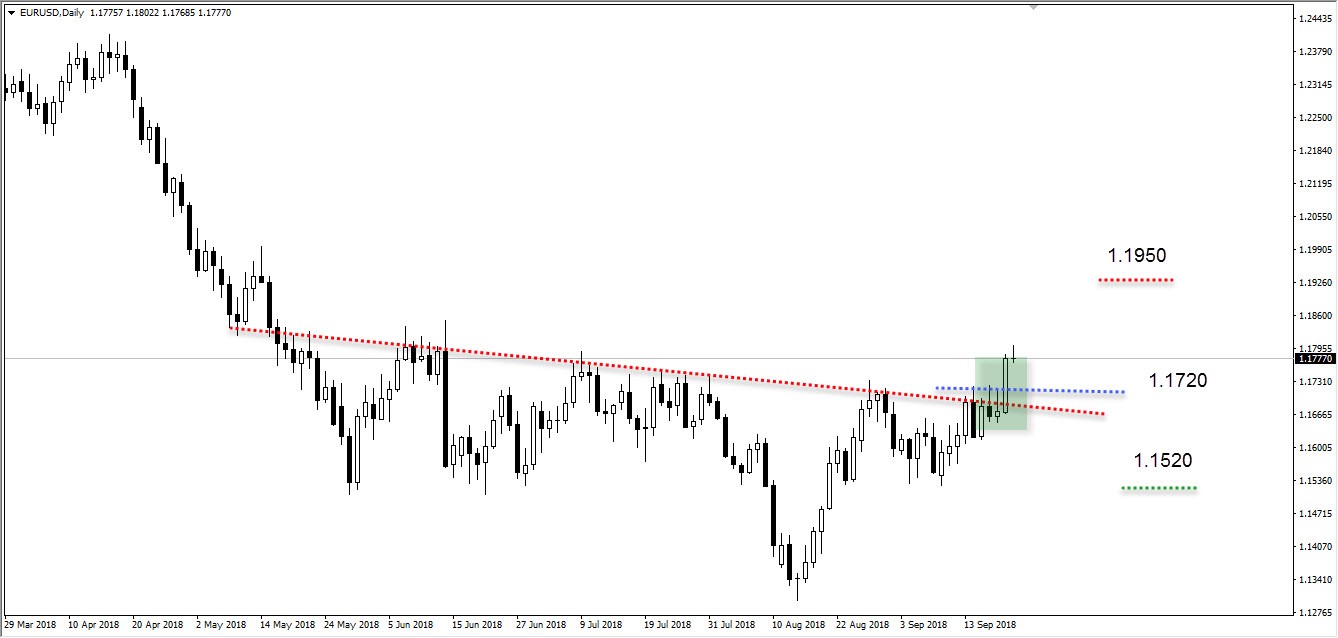
EUR/USD
EURUSD has broken its downward trendline on a daily time frame. The price is trading in a bullish breakout and this confirms that the trend is skewed to the upward. Having said this, the price is firmly trading above the major levels at 1.1720 which shows that the there is a higher chance that the price may continue its bullish wave. The Balance of Power shows that the bulls are still controlling the momentum.
The resistance is shown by the red horizontal line which is the highest point which the price made on the 15th of May. The support is show by the green line which is the lowest point formed on the 21st of August.
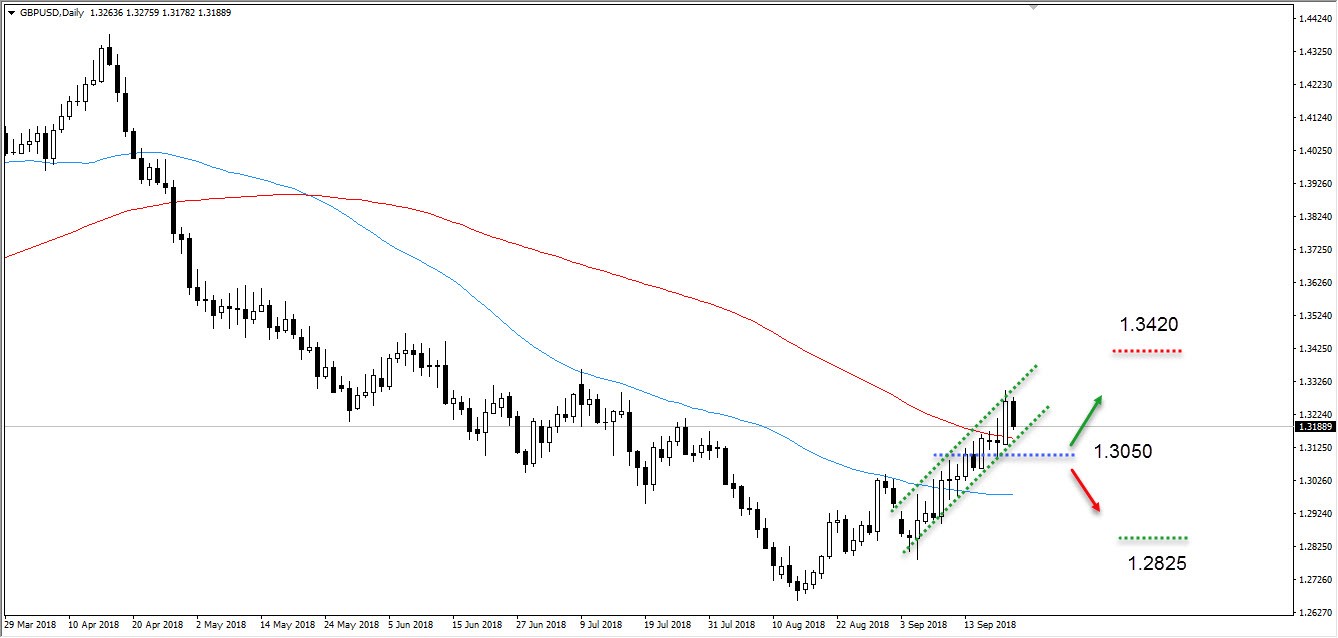
GBP/USD
Sterling has broken a critical level at 1.3050 on daily time frame. The price is trading in a bullish tight upward channel and this confirms that the trend is skewed to the upside. Having said this, the price is firmly trading above the 50 and 100-day moving averages which shows that the there is a higher chance that the price continue its upward move. Currently, there is a battle between the price and the 100-day moving average and if the price holds above it, the odds will be even stronger that the uptrend will shape up from there.
The Balance of Power shows that the bulls are still controlling the momentum, we need to see buying pressure continues.
The resistance is shown by the red horizontal line which is the highest point which the price made on the 14th of June. The support is show by the green line which is the lowest point formed on the 5th of September.
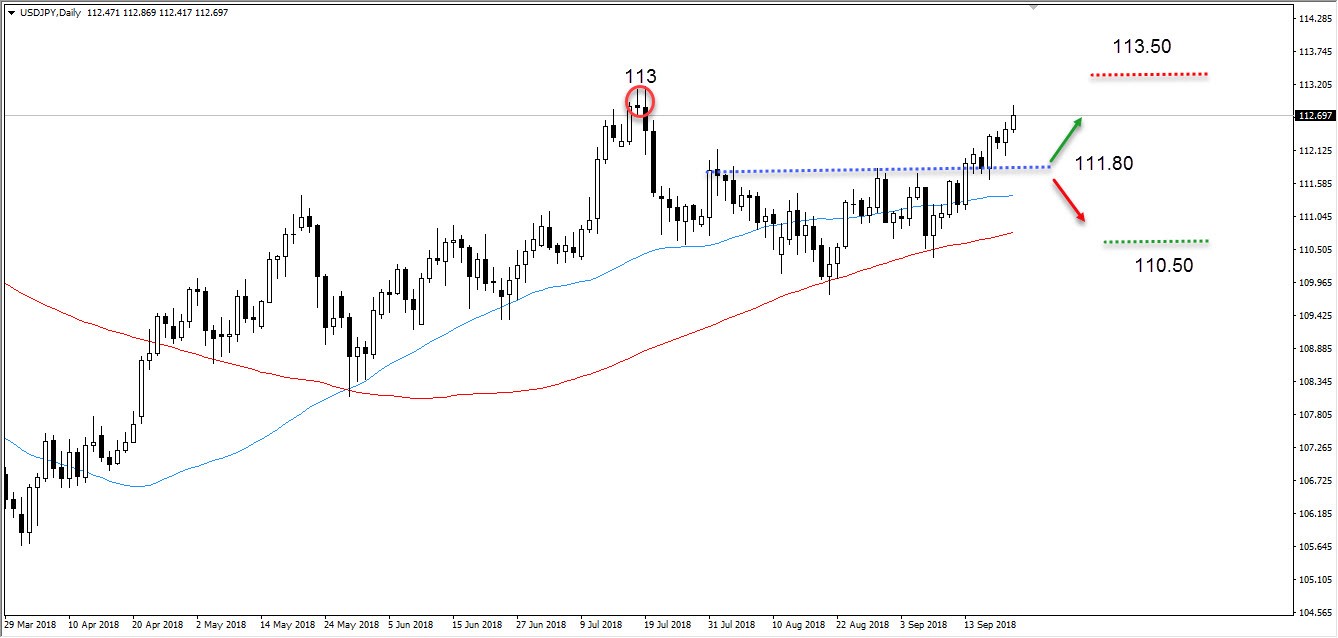
USD/JPY
EURUSD has broken its downward trendline on a daily time frame. The price is trading in a bullish breakout and this confirms that the trend is skewed to the upward. Having said this, the price is firmly trading above the major levels at 111.80 which shows that the there is a higher chance that the price may continue its bullish wave. The Balance of Power shows that the bulls are still controlling the momentum.
The resistance is shown by the red horizontal line which is the highest point which the price made on the 27th of December,2017. The support is show by the green line which is the lowest point formed on the 13th of September.
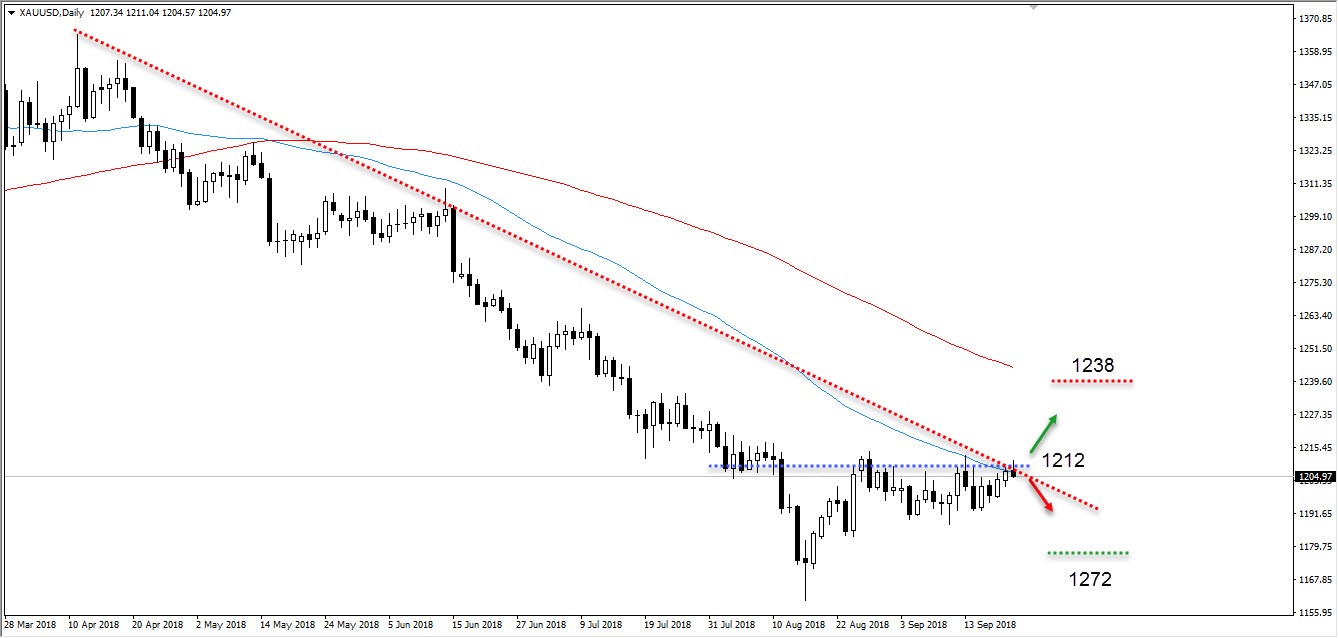
XAU/USD
Gold is trading within a range market on a daily time frame. The price is trading tight range between 1212 and 1195. Having said this, the price is firmly trading below the 50 and 100-day moving averages which shows that there is an equal chance between a bullish and bearish breakout. Currently, there is a battle between bears and bulls if the price breaks towards the upside (closing higher than 1212s levels), the odds will be even stronger that the uptrend will shape up from there.
The resistance is shown by the red horizontal line which is the highest point which the price made on the 17th of July. The support is show by the green line which is the lowest point formed on the 16th of August.
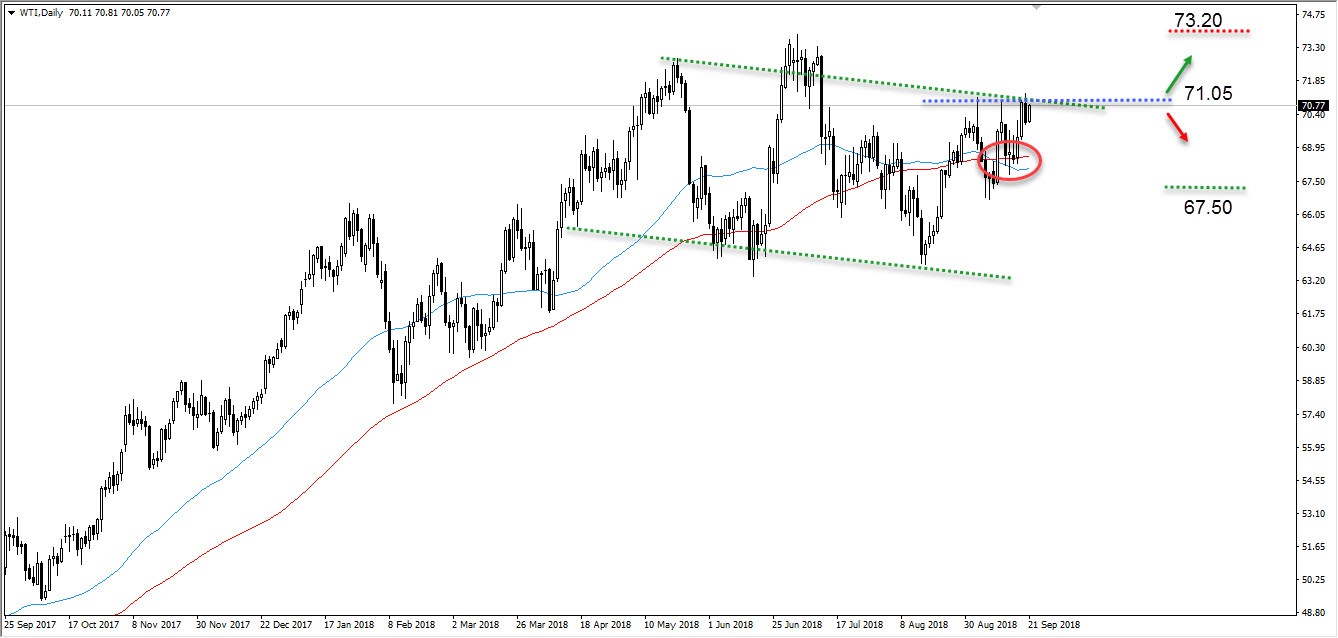
WTI
Oil is trading at the upper boundary of the declining channel on a daily hour time frame. The price is trading in a downward channel and this confirms that the trend is skewed to the downside. Having said this, the price is firmly trading above the 50 and 100-day moving averages with a weakness which shows that there is a higher chance that the price may move downward to the moving averages crossovers point at 68.50.
The Balance of Power shows that the bears are still controlling the momentum, we need to see this continue and that would support the above argument.
The resistance is shown by the red horizontal line which is the highest point which the price made on the 10th of July. The support is show by the green line which is the lowest point formed on the 18th of September.
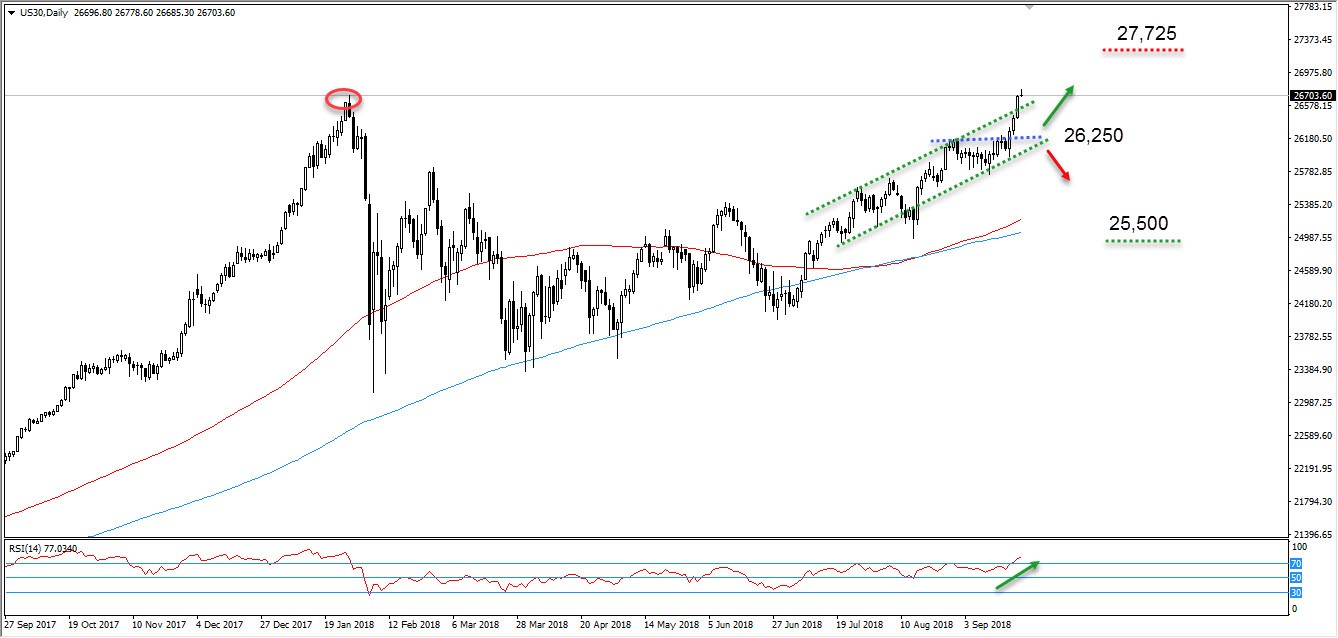
Dow Jones
Dow Jones has broken all time highs on a daily hour time frame. The price is trading in a bullish upward channel and this confirms that the trend is skewed to the upside. Having said this, the price is trading above the 100 and 200-day moving averages which shows that the there is a higher chance that the price may continue is upward move.
The Balance of Power shows that the bulls are controlling the momentum, we need to see this build up and that would support the above argument.
The resistance is shown by the red horizontal line which a result of the expected of a measure move. The support is show by the green line which is the lowest point formed on the 23rd of August.