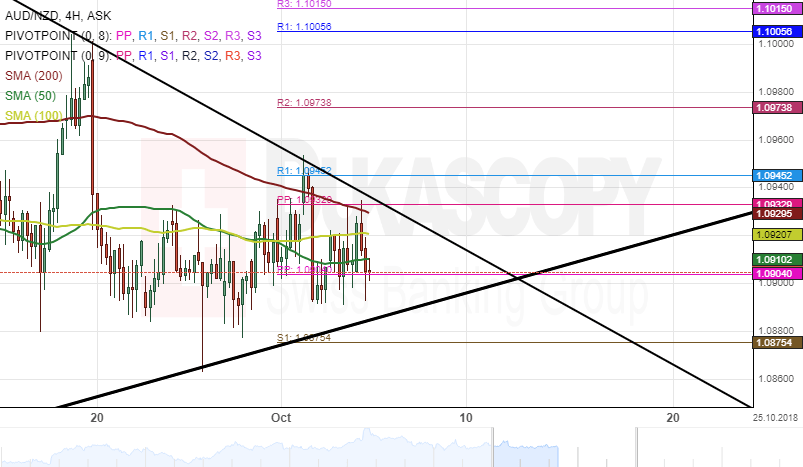
The Australian Dollar has been trading in a medium-scale triangle pattern against the Swiss Franc. The currency pair tested the upper boundary at 1.1005 on September 19 and breached the lower border at 1.8060 on September 26.
Currently, the exchange rate is stranded between SMAs. The 200-hour simple moving average is providing resistance at 1.0930, while the 50-hour moving average is providing support at 1.0904.
Technical indicators on the 4(H) time frame suggest that the currency exchange rate will move past the resistance level as mentioned earlier.
If this situation occurs, the target for the rate will be at the weekly R2 at 1.0973 during the following trading session.