
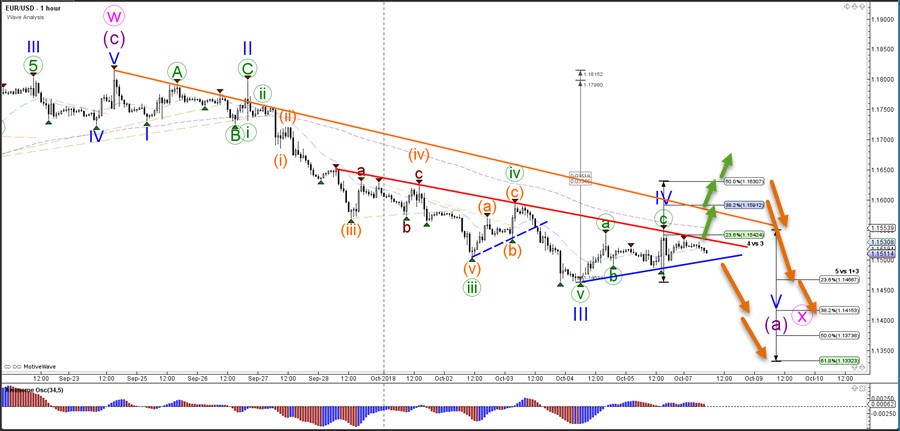
The EUR/USD is building a contracting triangle pattern and is awaiting a bullish or bearish breakout. A bullish breakout would make the wave X (pink) correction more likely whereas a bearish breakout could also indicate a downtrend.
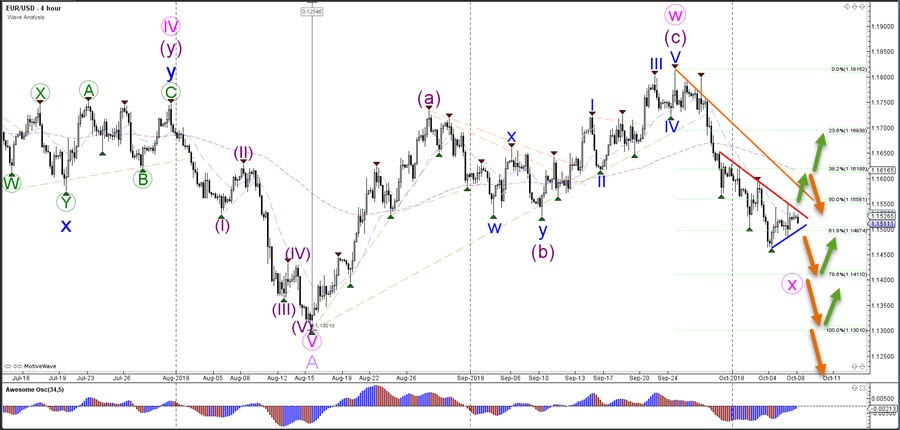
Another key support zone for the EUR/USD is the 78.6% Fibonacci retracement level and a break below that could make the wave X (pink) less likely.
The EUR/USD made a pullback to the 23.6% Fibonacciretracement level of wave 4 vs 3, which has acted as resistance so far. A breakout below the support trend line (blue) would indicate a continuation lower. This could be as part of a wave 5 (blue) of wave A (purple) unless price breaks below the 78.6% Fib of the 4 hour chart because then a downtrend could be in play.


