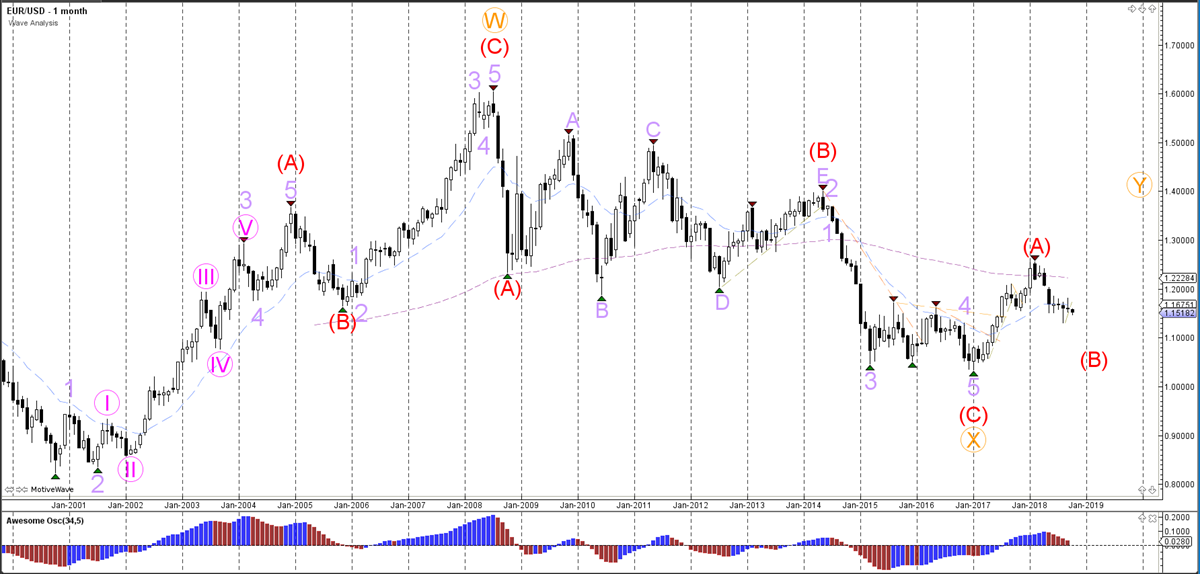
EUR/USD
The EUR/USD currency pair has either completed a wave B (purple) at the recent high, or the price will still expand the bullish correction via the WXY (pink) within wave B (purple). The main support level to something to keep an eye on, because of the current 1.15 round level and the 78.6% Fibonacci level around 1.1410. A bullish break above the 1.1550 with intra-day trading could already indicate a potential bullish bounce.
Daily chart:
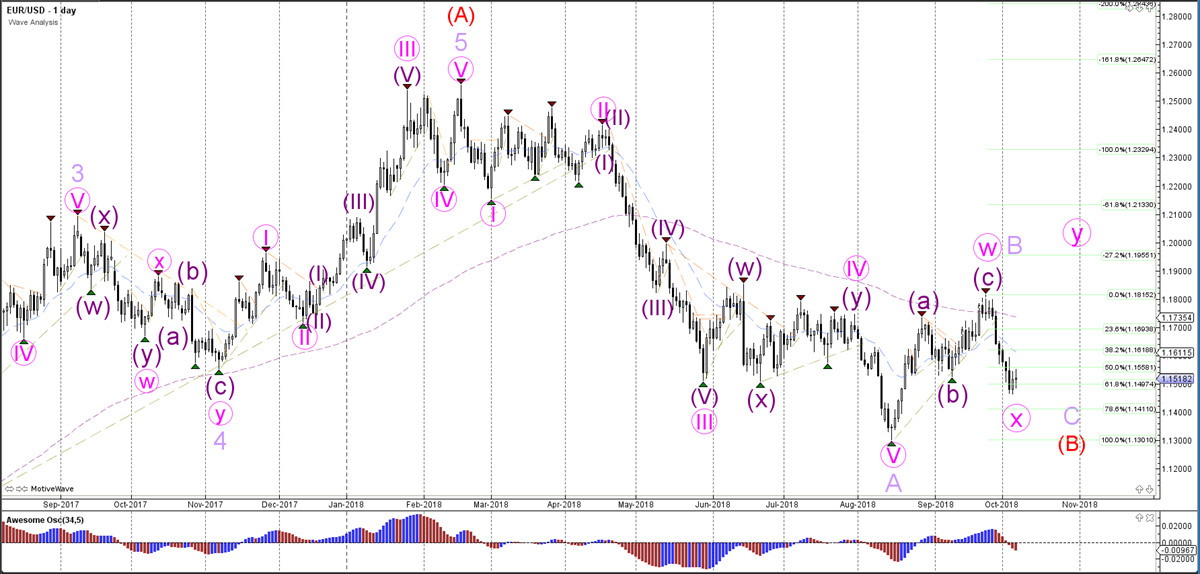
The EUR/USD currency pair is expecting a bearish ABC (purple) correction within wave B (red). The price is most likely retracing to the Fibonacci levels of wave B (purple).
Weekly chart:
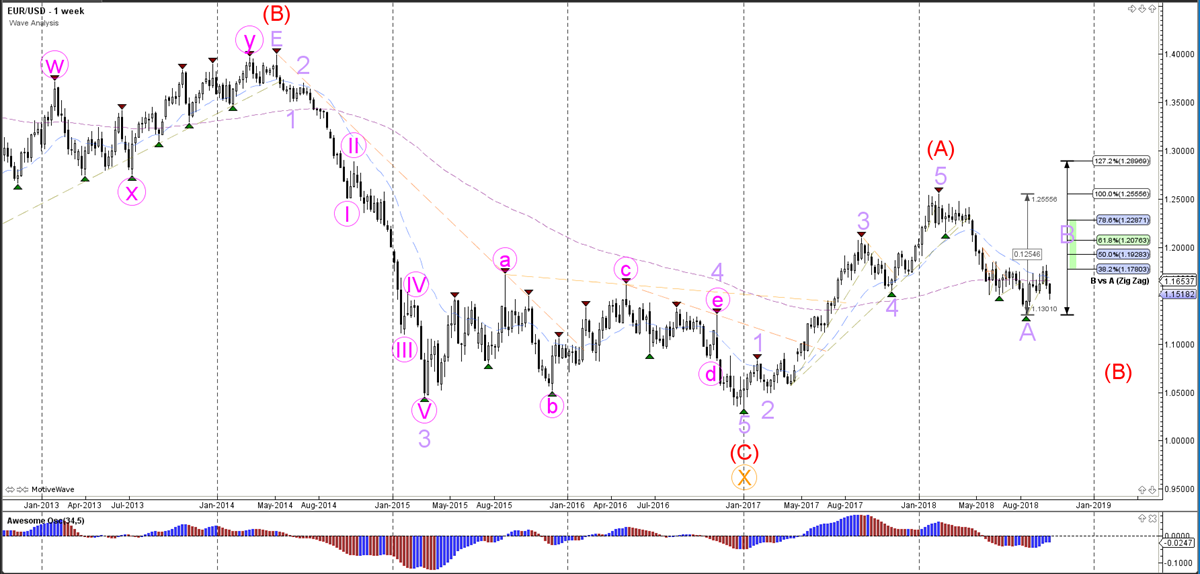
The EUR/USD currency pair has completed wave A (red) and the price is now probably in a wave B (red), unless the price breaks below the bottom of wave A.
Monthly chart:
GBP/USD
The GBP/USD currency pair made a bullish bounce at the support trend line (blue). A break below that support trend line could indicate a bearish breakout and trend continuation towards the Fibonacci targets of wave 5 (pink). A break above the previous top could indicate an expanded wave 4 (pink).
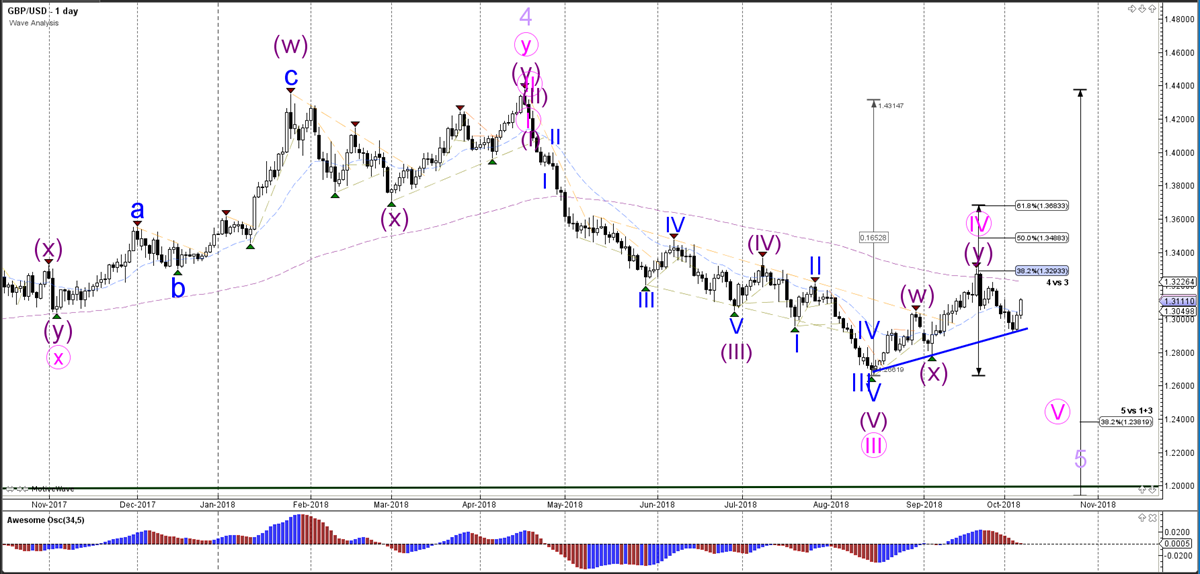
Daily chart:
The GBP/USD currency pair has probably started the bearish wave 5 after the price has completed a wave 4 (light purple) correction.
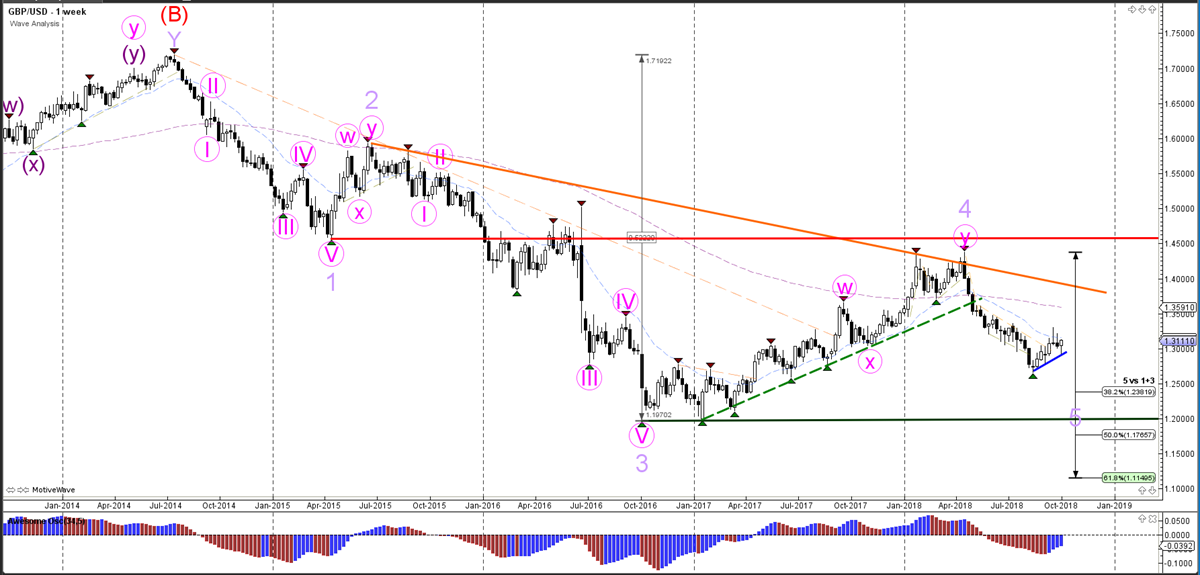
Weekly chart:
The GBP/USD currency pair is probably moving lower as part of the wave 5 (purple), whereas a bullish break above the resistance (orange) trend line indicates that a different wave pattern is valid.
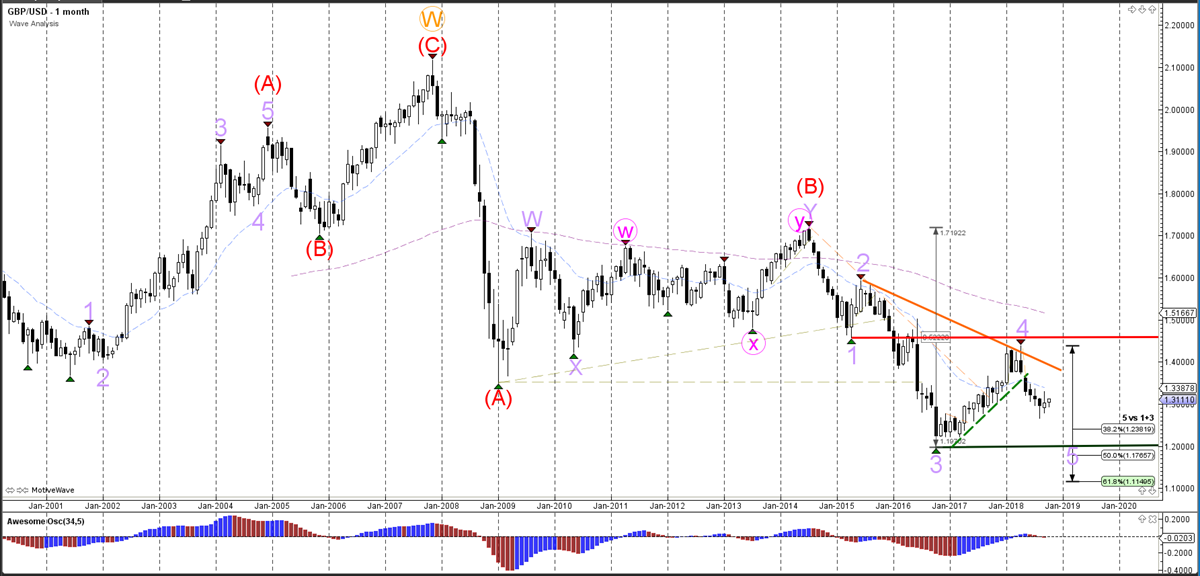
Monthly chart:
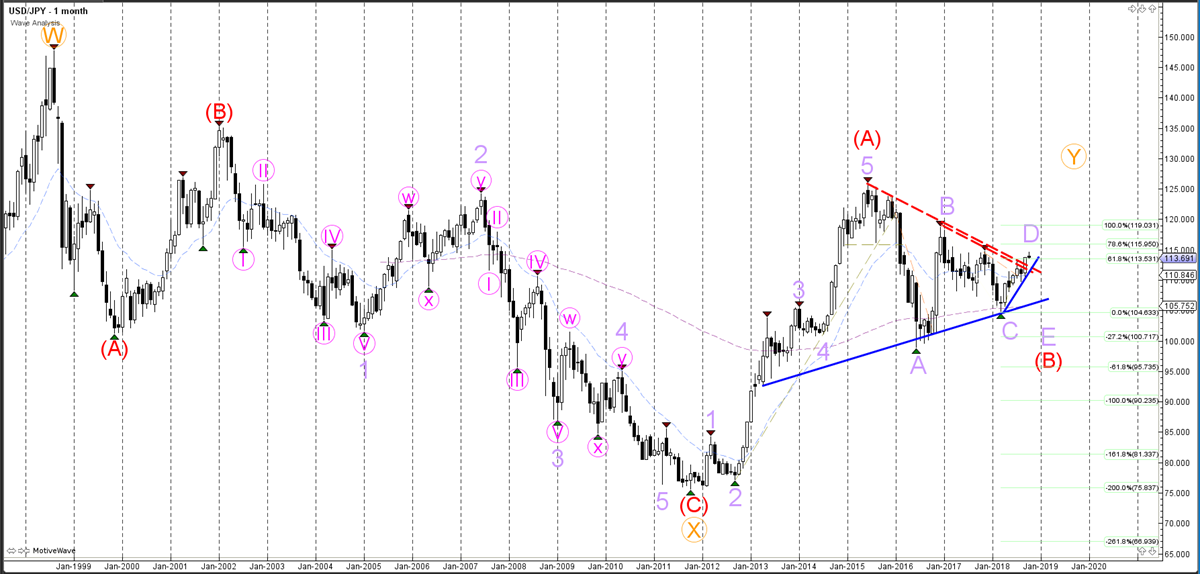
USD/JPY
The USD/JPY currency pair seems to be building a WXY (pink) correction within wave D (purple).
Daily chart:
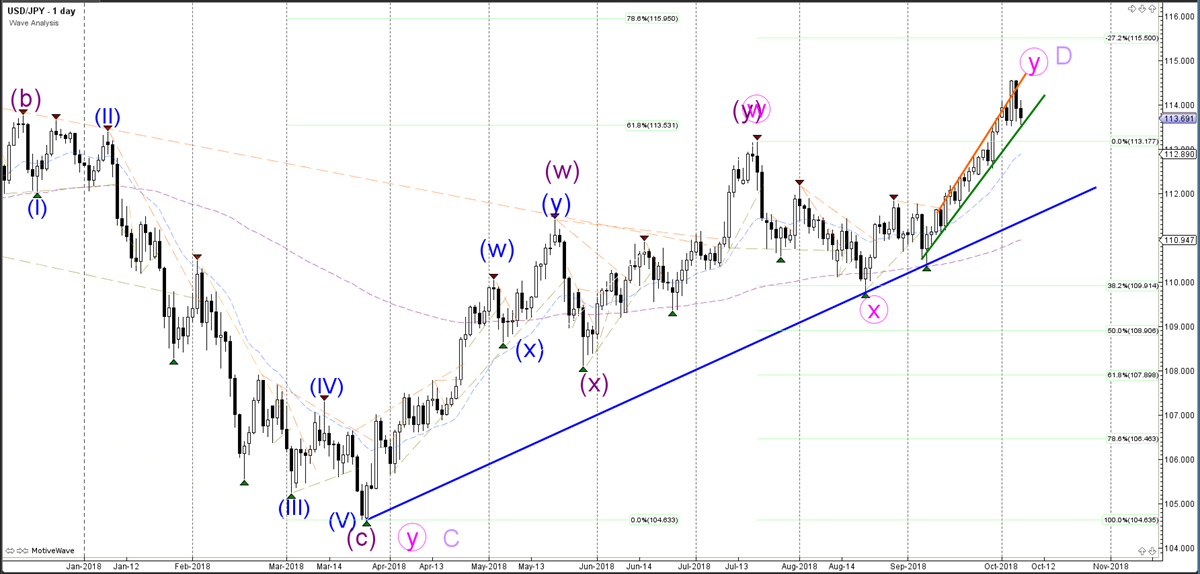
The USD/JPY currency pair broke above the resistance trend lines (dotted red), which is either the start of a bullish trend or still part of the larger ABCDE triangle (light purple) within wave B (red).
Weekly chart:
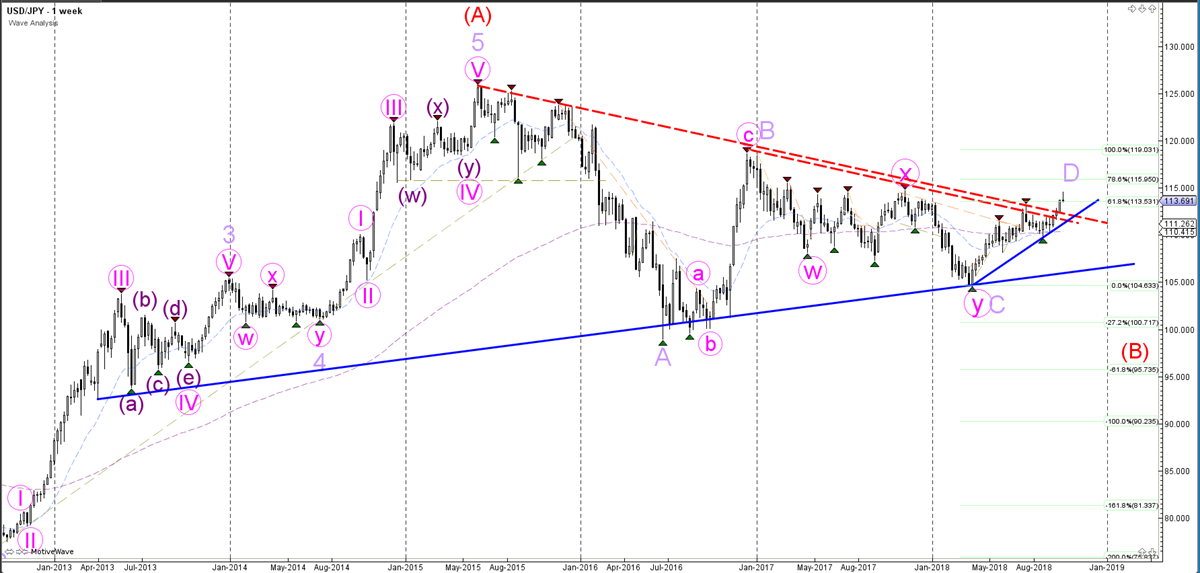
The USD/JPY currency pair is probably still in the wave D (light purple) of the triangle pattern, unless it breaks above the 78.6-100% Fibonacci resistance zone. Whether the price will bounce or break will depend on the upcoming candlestick patterns.
Monthly chart: