The NZD/CAD currency pair has been trading in a descending channel for the past few months now. This steady decrease in price range began when the rate reversed from the upper boundary of a long-term descending channel at 0.91 on June 22.
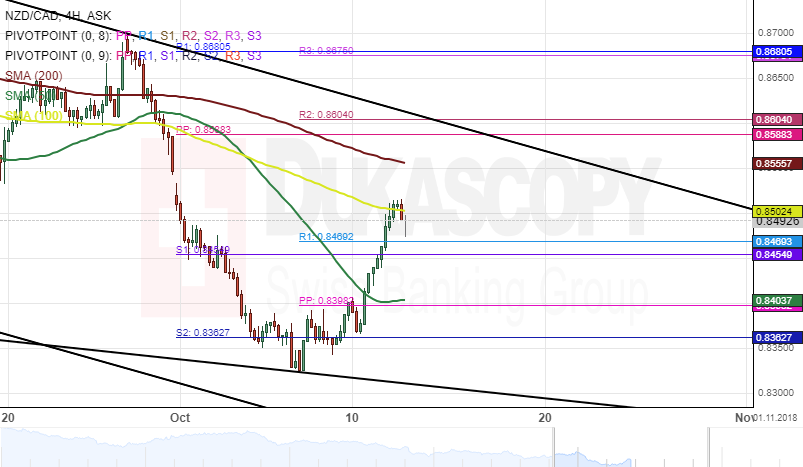
As shown on the 4(H) chart, the exchange rate has tested a resistance level formed by the 100-hour simple moving average at 0.8503 during the first part of today’s session.
If that resistance level holds, the currency exchange rate could aim at a support cluster set by the weekly and the monthly PPs near the 0.8469 within this trading session.
On the other hand, if the price passes that resistance line as mentioned earlier, the pair could move towards the 200-hour SMA at 0.8556.