
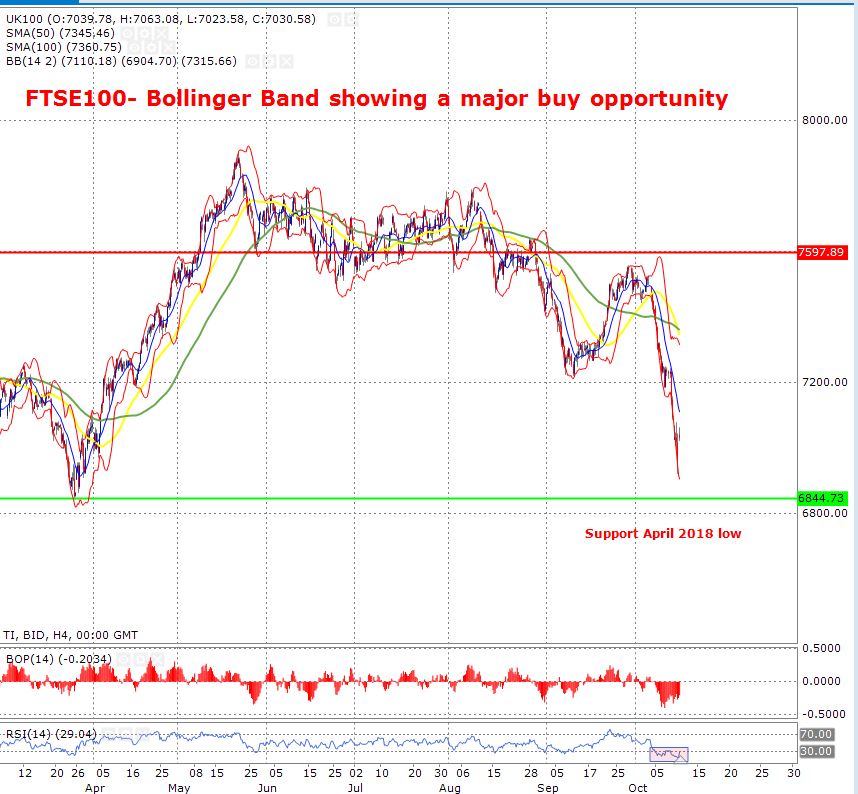
There is one clear signal when you look at the FTSE 100 4-hour chart. The price is way oversold and a rebound trade or at least the price consolidation is strongly on the cards. The reason behind this argument is that the price has pierced the lower line of the Bollinger band which generally generates a buy signal. When such an extreme signal takes place, the price usually moves towards its mean (the 20-day moving average shown in blue). At the same time, the Relative Strength Index is also showing that the price is oversold and the RSI is trading below the 30-mark. A reading which is near 30 or below 30 shows that the price is oversold and a reading above 70 or near 70 shows that the price is way overbought and a correction may take place.
Leaving the Bollinger band and the RSI on one side, the strength of the downtrend can also be measured by looking at the 50-day and 100-day moving averages. The 50-day moving average is shown in yellow and the 100-day moving average is shown in green. The 50-day moving average has dropped below the 100-day moving average and this shows that the downtrend is very strong.
The major support is 6844 and the resistance is 7597
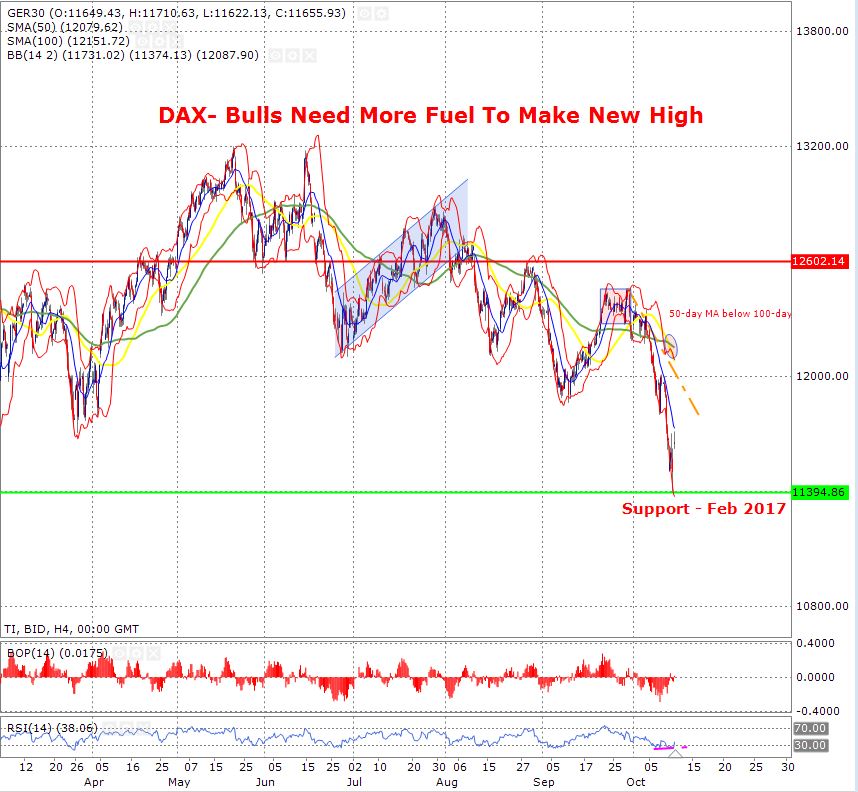
DAX Is Over Sold, The Price Can Bounce Back
The intra-day chart for the Dax index is very similar to that of FTSE 100. The 4-hour time frame chart shows that the price is also oversold and the confirmation is coming from the Bollinger band. When the price pierces the lower band of the Bollinger band, it shows that the price is oversold and when the price pierces the upper line of the Bollinger band, it shows that the price is oversold. However, one important thing to note is that the price of DAX index has moved back into the Bollinger band fairly quickly and the upcoming resistance for the price is the 20-day moving average (shown in blue).
The Balance of Power indicator shows that the bears are losing control of the price and bulls have started to handle things much better. Having said this, the price needs to break above the downward trend line and this will give us a confirmation that we have an upward trend.
The major support is at 11394 and the resistance is at 12602


