
The EUR/USD currency pair
Technical indicators of the currency pair:
Prev Open: 1.14683
Open: 1.14698
% chg. over the last day: +0.05
Day’s range: 1.14557 – 1.14767
52 wk range: 1.1299 – 1.2557
The technical pattern on the EUR/USD currency pair is ambiguous. Quotes are moving in a flat. Investors took a wait-and-see attitude before the ECB meeting, which will be held on October 25. At the moment, local support and resistance levels are: 1.14400 and 1.14800, respectively. We recommend opening positions from these marks.
Economic calendar on 24.10.2018:
The index of economic activity in the manufacturing sector (PMI) of Germany at 10:30 (GMT+3:00);
New home sales in the US at 17:00 (GMT+3:00);
Fed’s “Beige Book” at 21:00 (GMT+3:00).
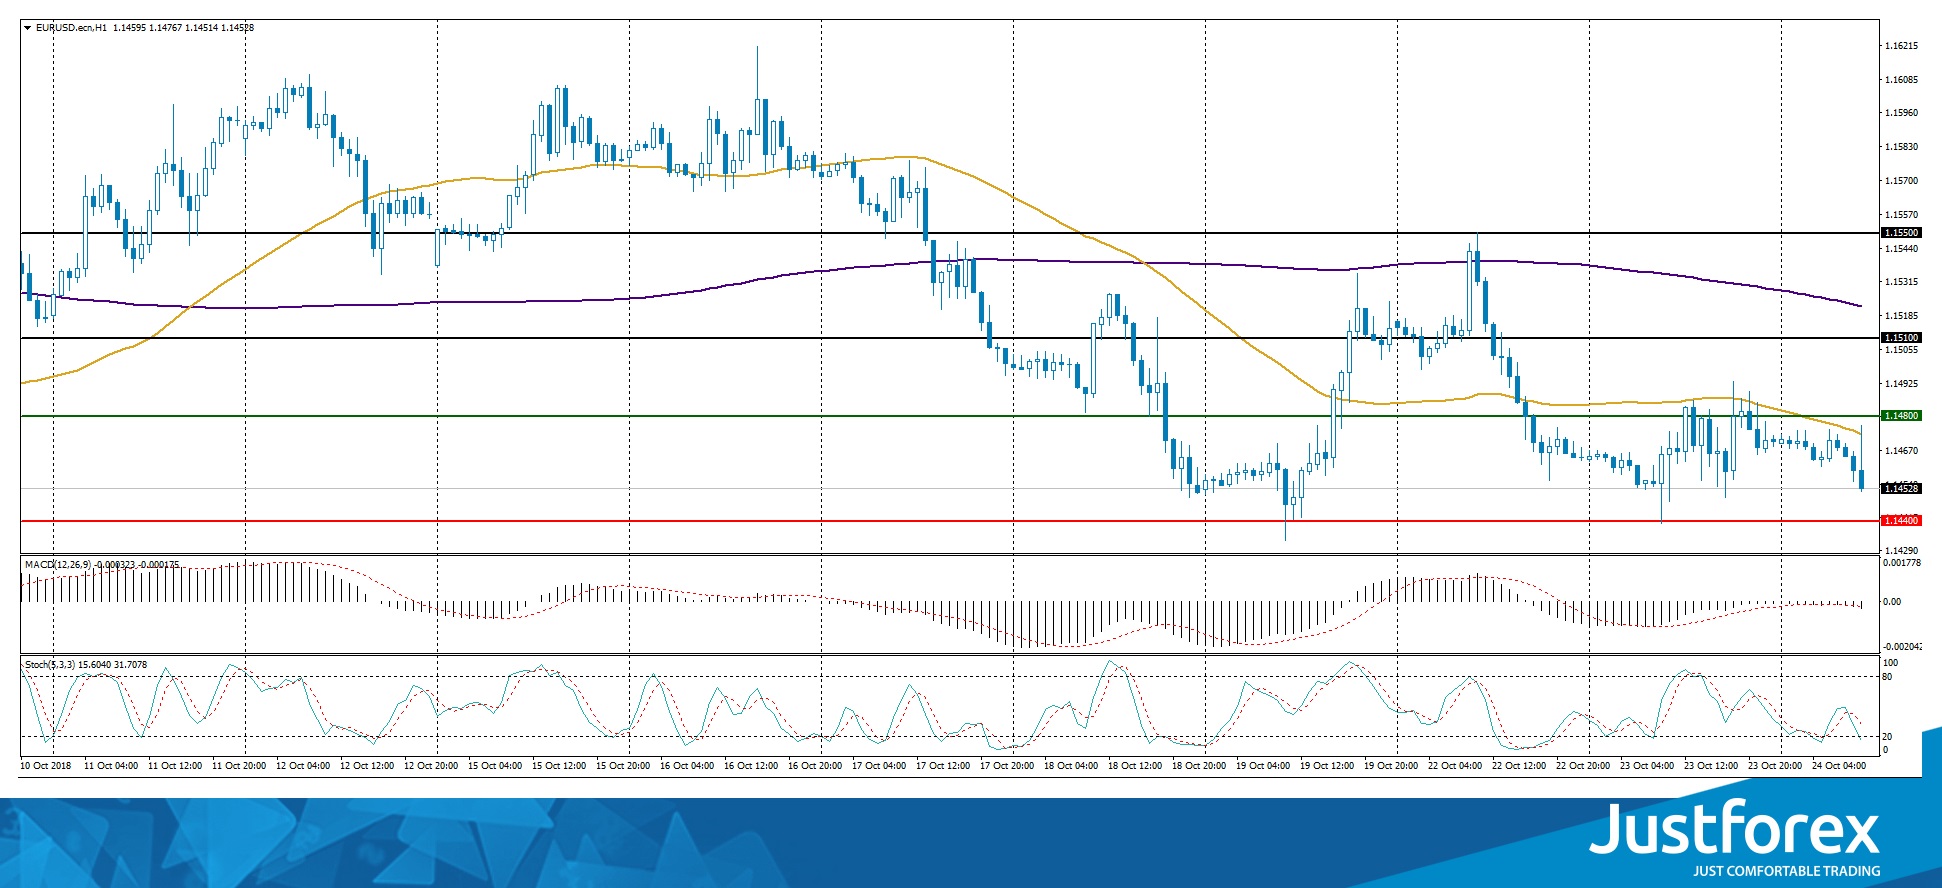
The price has fixed below 50 MA and 200 MA, which indicates the power of sellers.
The MACD histogram has moved to the negative zone, which indicates the bearish sentiment.
Stochastic Oscillator is in the neutral zone, the %K line is below the %D line, which also gives a signal to sell EUR/USD.
Trading recommendations
Support levels: 1.14400, 1.14000
Resistance levels: 1.14800, 1.15100, 1.15500
If the price fixes above the resistance level of 1.14800, the EUR/USD quotes are expected to grow. The movement is tending to 1.15100-1.15500.
An alternative may be the decrease of the EUR/USD currency pair to the round level of 1.14000.
The GBP/USD currency pair
Technical indicators of the currency pair:
Prev Open: 1.29567
Open: 1.29821
% chg. over the last day: +0.14
Day’s range: 1.29448 – 1.29839
52 wk range: 1.2662 – 1.4378
The GBP/USD currency pair is in a sideways trend. Investors expect additional drivers. At the moment, the local support and resistance levels are: 1.29350 and 1.29850, respectively. Positions should be opened from these marks. We recommend following current information regarding the Brexit process.
The news feed on the UK economy is calm.
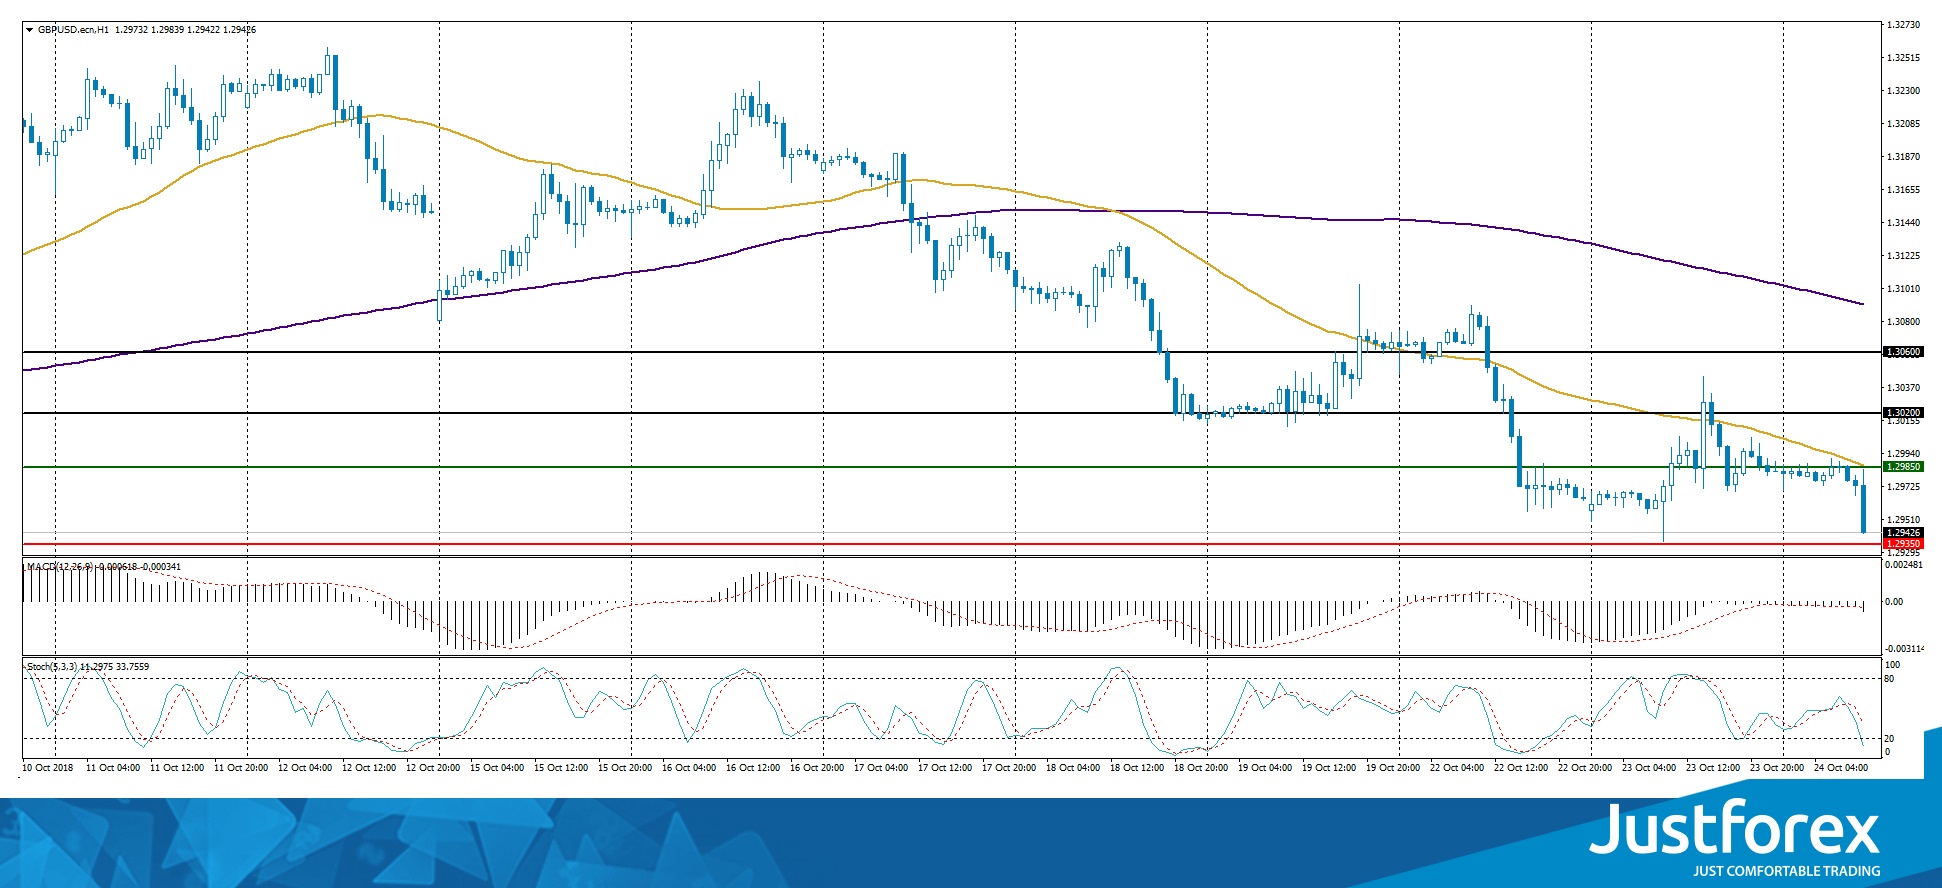
Indicators point to the power of sellers: the price is being traded below 50 MA and 200 MA.
The MACD histogram has moved to the negative zone, which gives a signal to sell GBP/USD.
Stochastic Oscillator is in the neutral zone, the %K line is below the %D line, which indicates the bearish sentiment.
Trading recommendations
Support levels: 1.29350, 1.29000
Resistance levels: 1.29850, 1.30200, 1.30600
If the price fixes below the support level of 1.29350, the GBP/USD quotes are expected to decline. The movement is tending to 1.29000-1.28800.
An alternative may be the GBP/USD currency pair growth to 1.30200-1.30400.
The USD/CAD currency pair
Technical indicators of the currency pair:
Prev Open: 1.30963
Open: 1.30864
% chg. over the last day: -0.14
Day’s range: 1.30783 – 1.30889
52 wk range: 1.2248 – 1.3387
The technical pattern emerged on the USD/CAD currency pair is ambiguous. Quotes are in a sideways trend. Financial markets participants expect the Bank of Canada interest rate decision. At the moment, the local support and resistance levels are: 1.30700 and 1.31000, respectively. Positions should be opened from these marks.
The news feed on 24.10.2018:
Bank of Canada interest rate decision at 17:00 (GMT+3:00).
Indicators do not send accurate signals: the price is being traded between 50 MA and 200 MA.
The MACD histogram is in the negative zone, but above the signal line, which gives a weak signal to sell USD/CAD.
Stochastic Oscillator is in the neutral zone, the %K line is above the %D line, which indicates the bullish sentiment.
Trading recommendations
Support levels: 1.30700, 1.30300, 1.30000
Resistance levels: 1.31000, 1.31400
If the price fixes above the round level of 1.31000, the USD/CAD quotes growth is expected. The movement is tending to 1.31400-1.31600.
Alternative option. If the price fixes below the support of 1.30700, it is necessary to look for entry points to the market to open short positions. The target movement level is 1.30300-1.30000.
The USD/JPY currency pair
Technical indicators of the currency pair:
Prev Open: 112.804
Open: 112.604
% chg. over the last day: -0.34
Day’s range: 112.424 – 112.553
52 wk range: 104.56 – 114.74
Yesterday, a variety of trends was observed on the USD/JPY currency pair. At the moment, local support and resistance levels are: 112.400 and 112.650, respectively. Investors expect additional drivers. Positions should be opened from the key levels. We recommend paying attention to the 10-year US government bonds yield.
The news feed on the economy of Japan is calm.
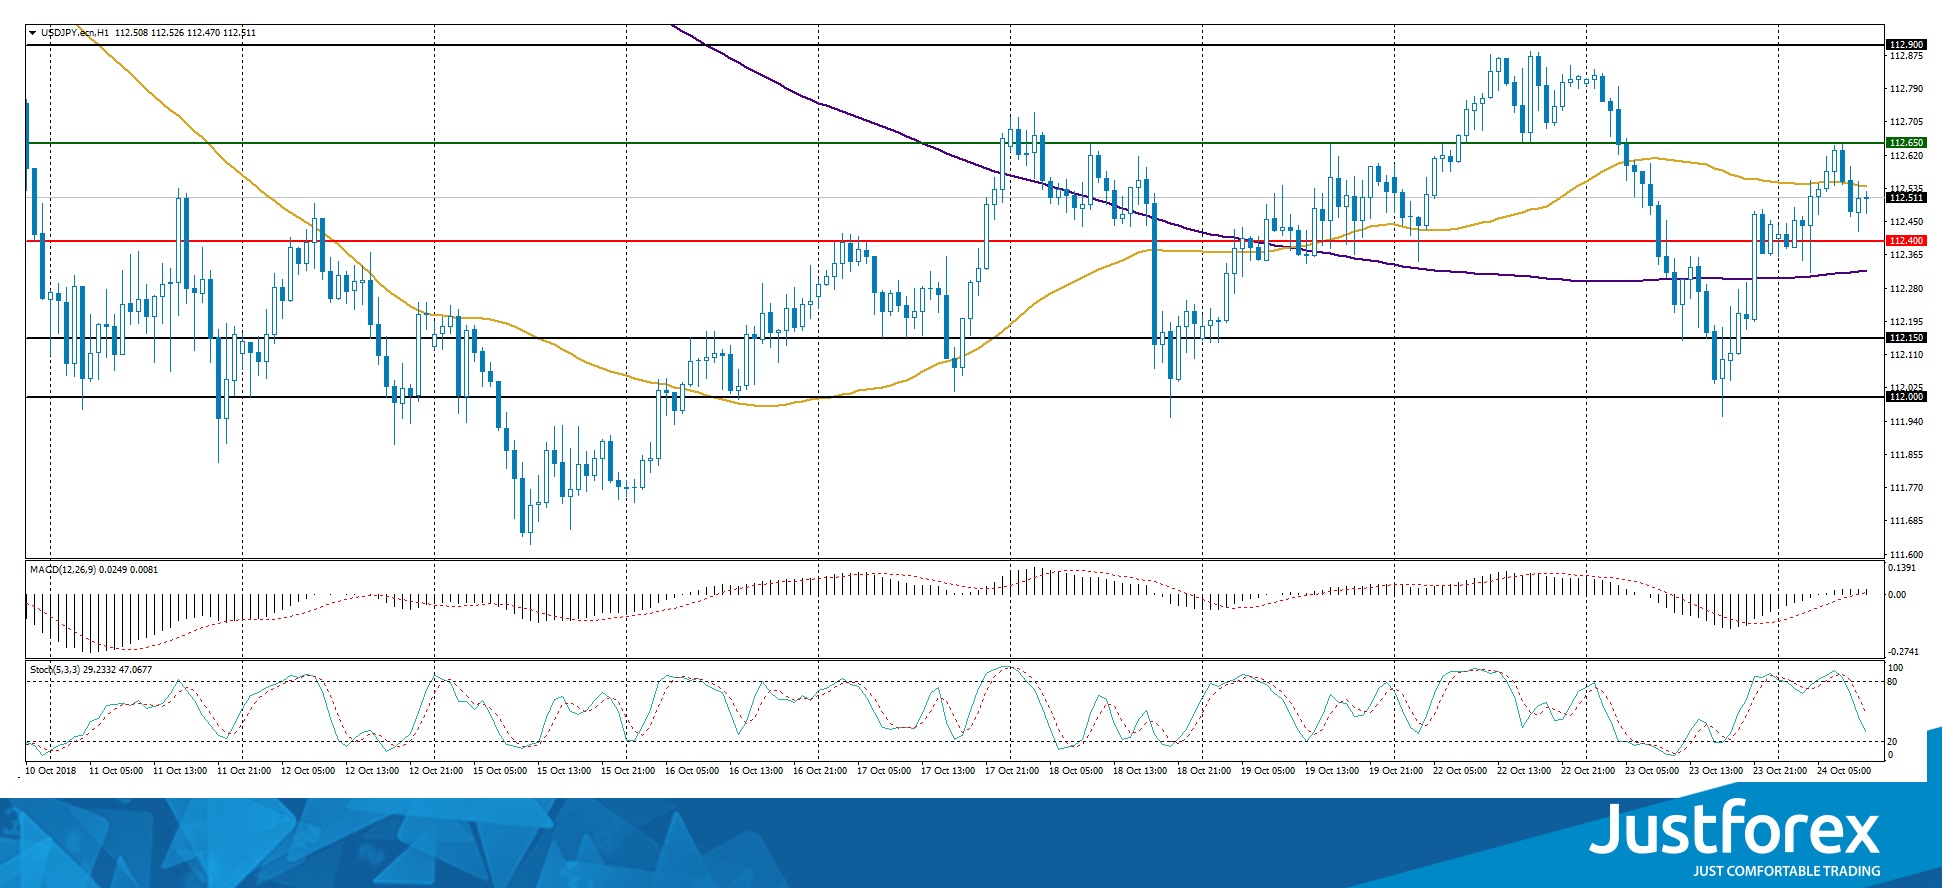
Indicators do not send accurate signals: the USD/JPY quotes have fixed between 50 MA and 200 MA.
The MACD histogram is near the 0 mark.
Stochastic Oscillator is in the neutral zone, the %K line is below the %D line, which indicates a decrease in quotes.
Trading recommendations
Support levels: 112.400, 112.150, 112.000
Resistance levels: 112.900, 113.200
If the price fixes above the resistance level of 112.900, the USD/JPY quotes growth is expected. The movement is tending to 113.200-113.400.
Alternative option. If the price fixes below the support of 112.400, we recommend looking for entry points to the market to open short positions. The target movement level is 112.150-112.000.


