
The EUR/USD currency pair
Technical indicators of the currency pair:
Prev Open: 1.14129
Open: 1.14520
% chg. over the last day: +0.35
Day’s range: 1.14423 – 1.14723
52 wk range: 1.1299 – 1.2557
EUR keeps showing a positive trend. During yesterday`s and today`s trading, the quotes grew by 50 points. The trading instrument is close to the monthly maximums. The local support and resistance levels are 1.14350 and 1.14750. The currency pair can grow further. You should open positions from the key levels.
At 15:30 the US will publish some important stats from the real estate market.
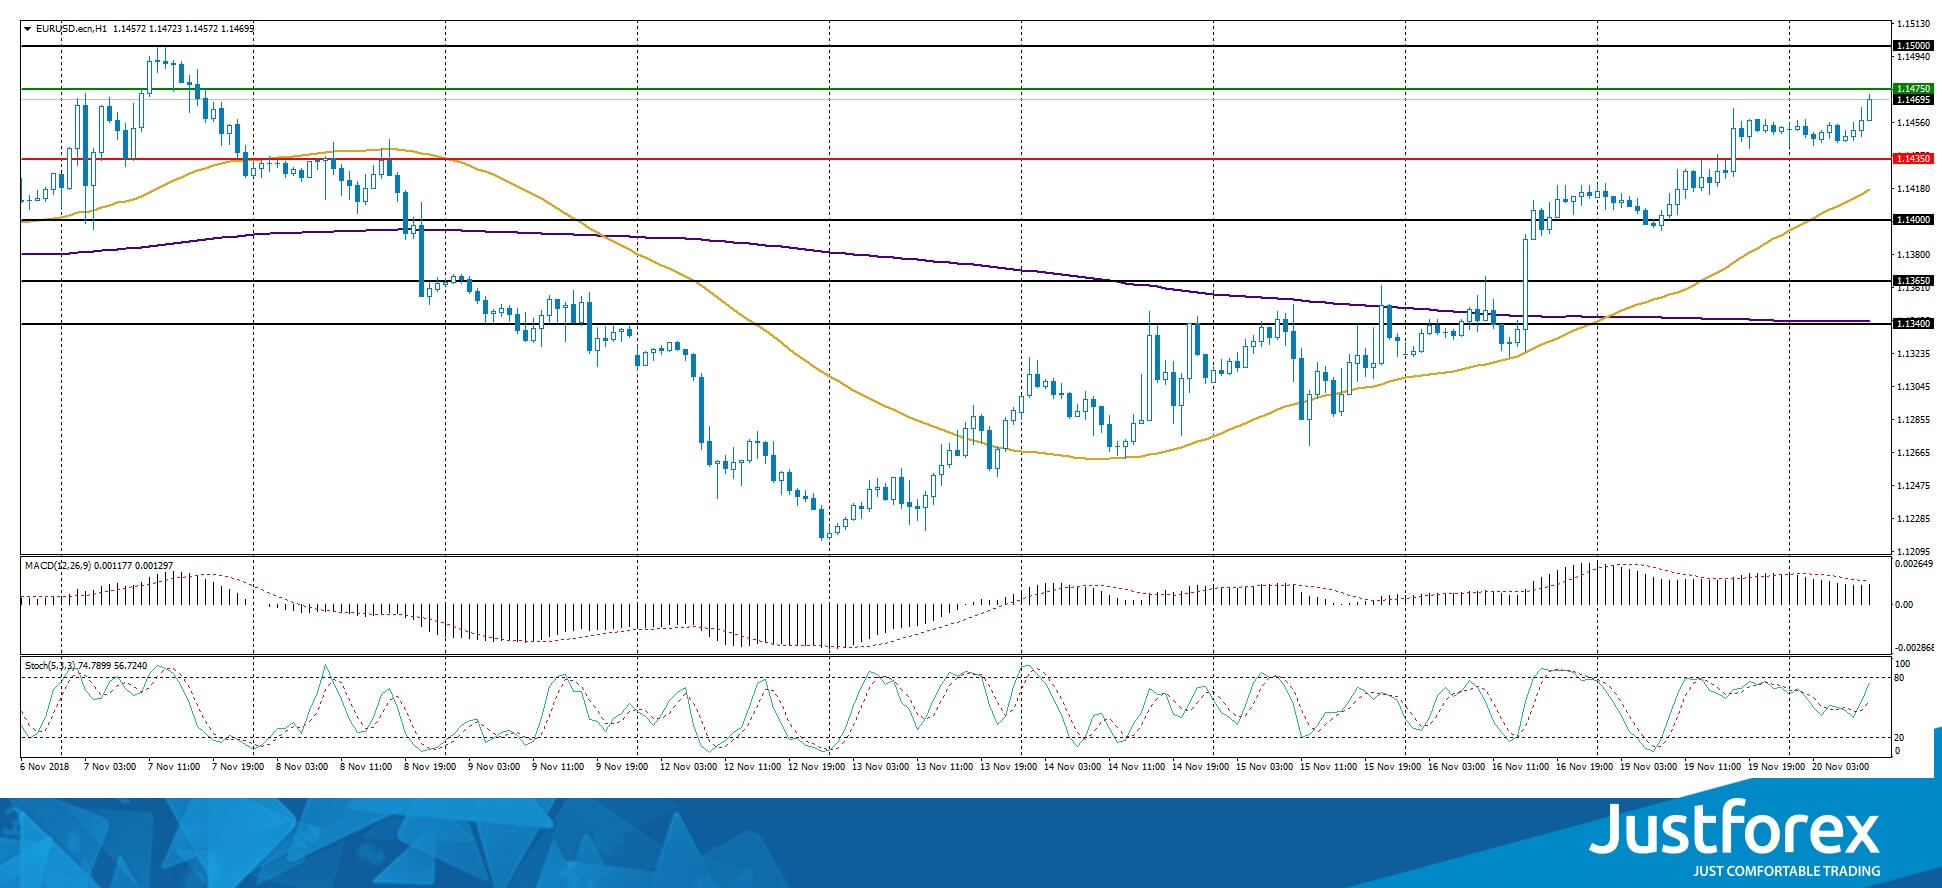
The indicators point toward the power of the buyers, the price fixed above 50 MA and 200 MA.
The MACD histogram is in the positive zone but below the signal line, which give a weak signal towards the purchase of EUR/USD.
The Stochastic Oscillator is in the neutral zone, the %K line is above the %D line, which indicates a bullish sentiment.
Trading recommendations
Support levels: 1.14350, 1.14000, 1.13650
Resistance levels: 1.14750, 1.15000
If the price fixes above 1.14750, expect further growth. Potentially towards 1.15000-1.15200.
Alternatively, the movement will correct toward 1.14200-1.14000.
The GBP/USD currency pair
Technical indicators of the currency pair:
Prev Open: 1.28440
Open: 1.28470
% chg. over the last day: +0.16
Day’s range: 1.28330 – 1.28808
52 wk range: 1.2662 – 1.4378
GBP/USD keeps trading in flat. There is no single trend here. The support and resistance levels are 1.28250 and 1.28850. Financial market participants wait for new data regarding Brexit. Positions should be opened from the key levels.
You should keep an eye on the statements by the Head of the Bank of England.
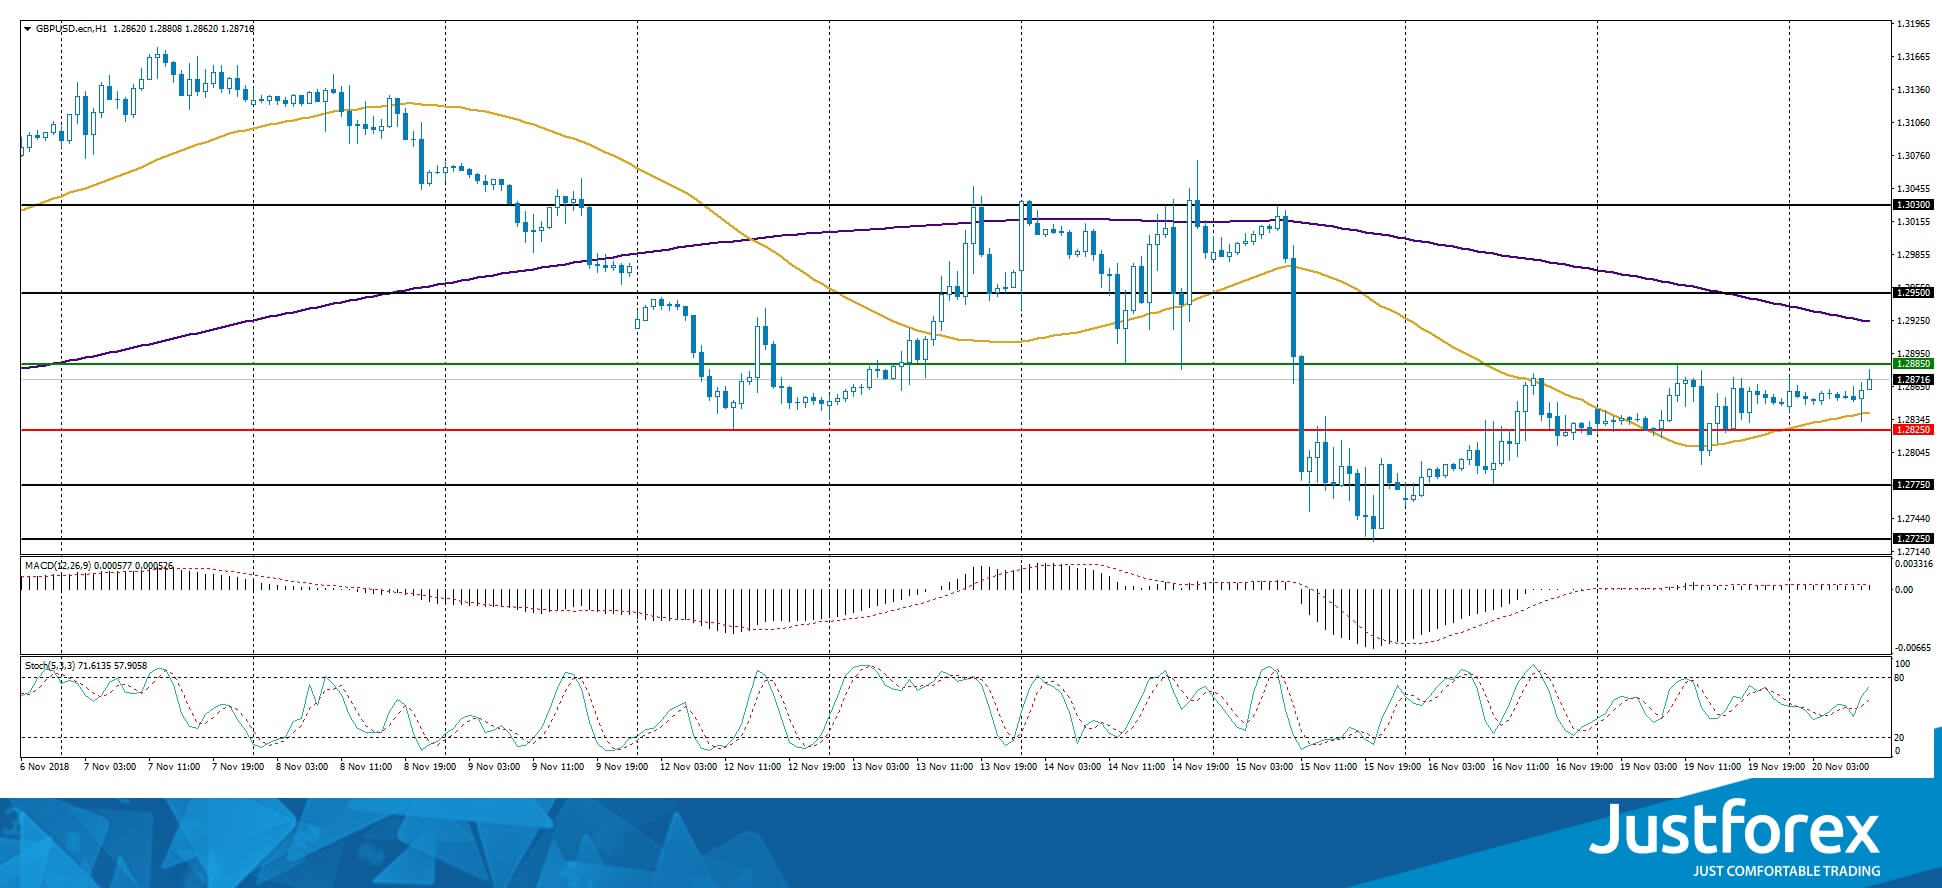
The price is between both 50 MA and 200 MA, there are no precise signals.
The MACD histogram is around 0. There are no precise signals.
The Stochastic Oscillator is in near the neutral zone, the %K line is above the %D line, which provides a signal towards a purchase of GBP/USD.
Trading recommendations
Support levels: 1.28250, 1.27750, 1.27250
Resistance levels: 1.28850, 1.29500, 1.30300
If the price fixes above the support 1.28850, expect further correction of the quotes toward 1.29400-1.29600.
Alternatively, the quotes can fall towards the round 1.28000.
The USD/CAD currency pair
Technical indicators of the currency pair:
Prev Open: 1.31489
Open: 1.31693
% chg. over the last day: +0.19
Day’s range: 1.31554 – 1.31772
52 wk range: 1.2248 – 1.3387
The technical picture on USD/CAD remains ambiguos. It keeps testing the support and resistance levels of 1.31500 and 1.31800. The quotes have a tendency to descend. Investors are waiting for the important reports from the US. Positions should be opened from the key levels.
The News Feed for Canada is calm.
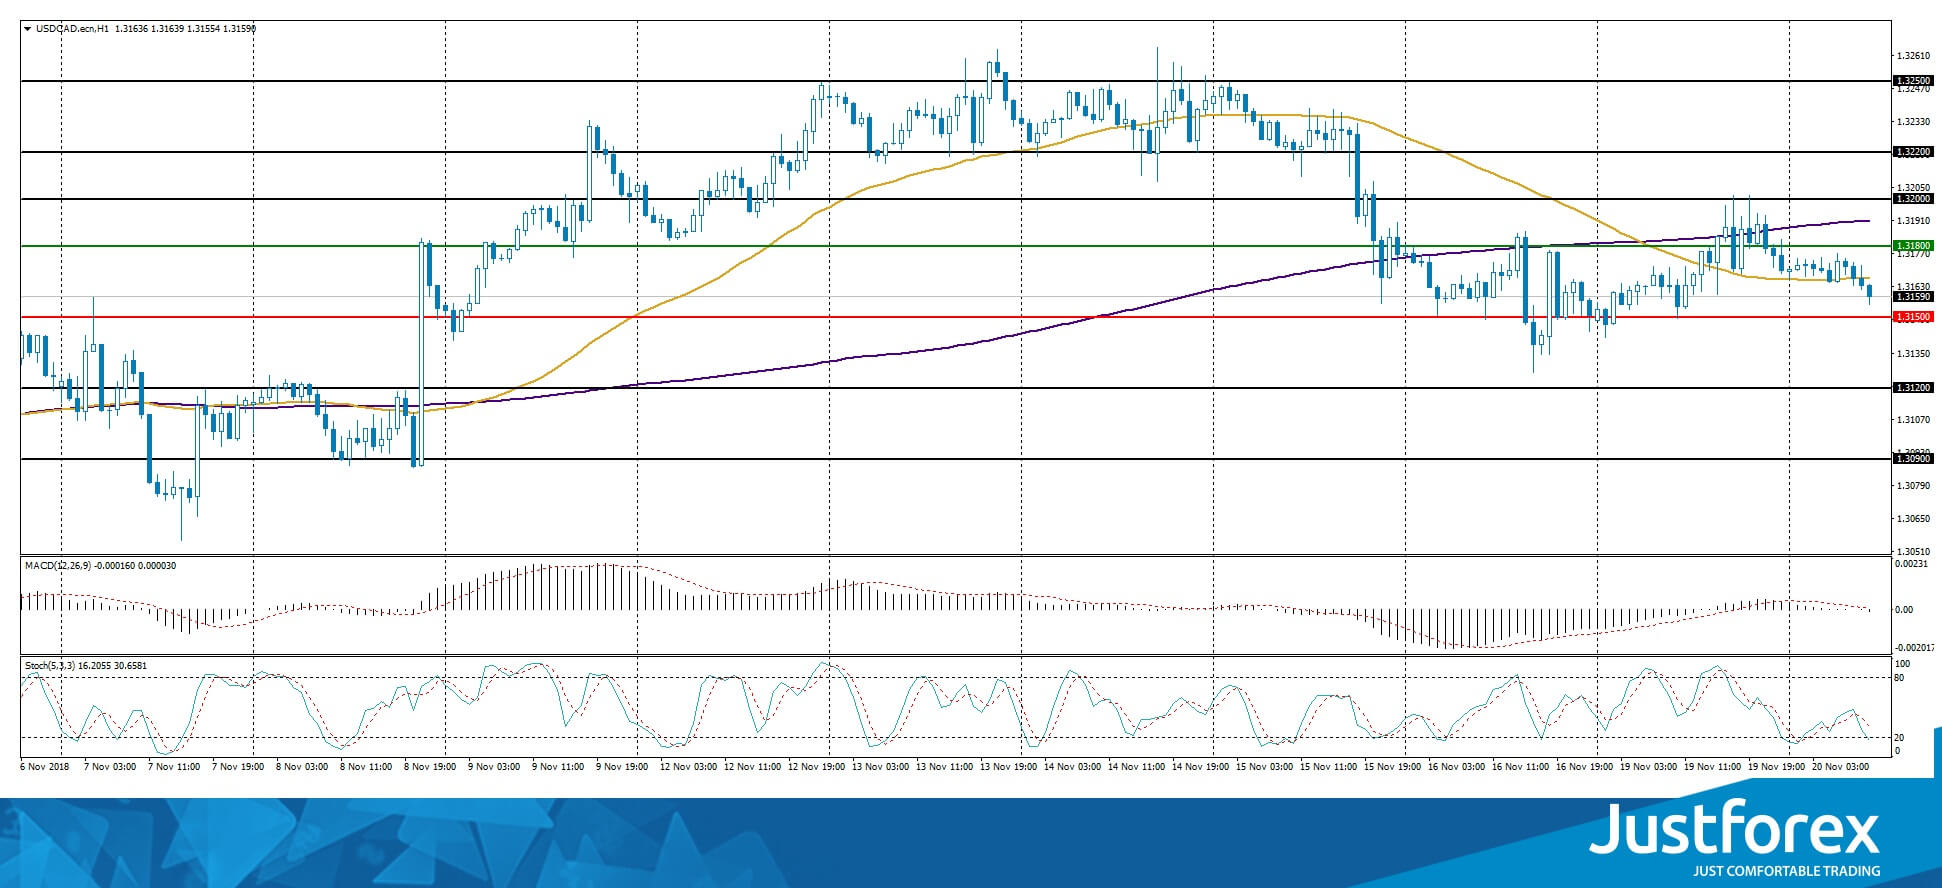
The indicators provide no signals: 50 MA has crossed 200 MA.
The MACD histogram is around 0.
The Stochastic Oscillator is in the neutral zone, the %K line is below the %D line, which indicates a bearish mood.
Trading recommendations
Support levels: 1.31500, 1.31200, 1.30900
Resistance levels: 1.31800, 1.32150, 1.32500
If the price fixes below 1.31150, consider selling USD/CAD. The movement will tend toward the round 1.31200-1.31000.
Alternatively, the currency pair can grow to 1.32000-1.32200.
The USD/JPY currency pair
Technical indicators of the currency pair:
Prev Open: 112.754
Open: 112.517
% chg. over the last day: -0.24
Day’s range: 112.374 – 112.661
52 wk range: 104.56 – 114.74
USD/JPY is still dominated by the bearish sentiment. The trading instrument has updated the local minimums. At the moment the USD/JPY quotes are consolidating. Positions should be opened from the key levels 112.350 and 112.650. The currency pair has a tendency to descend further.
The news feed is calm for today.
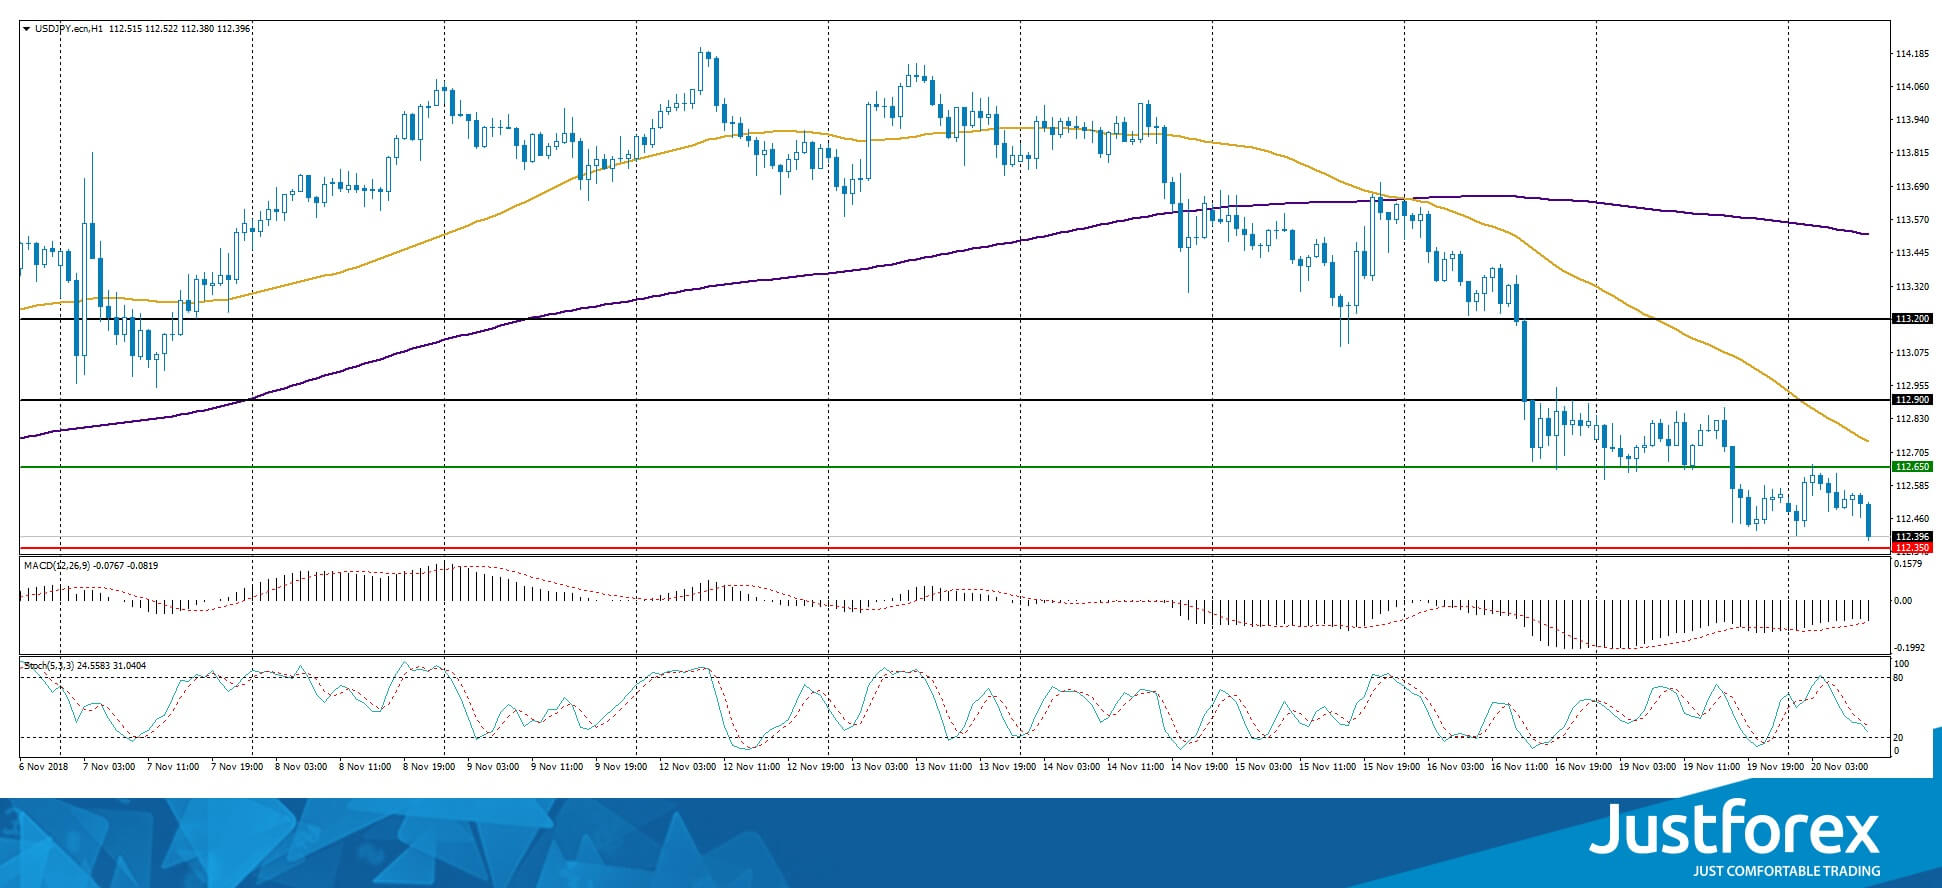
The price is below 50 MA and 200 MA, which indicates the power of the sellers.
The MACD histogram is around in the negative zone and keeps descending, which indicates a bearish mood.
The Stochastic Oscillator is in the negative zone, the %K line is below the %D line. It is also a signal to sell USD/JPY.
Trading recommendations
Support levels: 112.250, 112.000
Resistance levels: 112.650, 112.900, 113.200
If the price fixes below the support 112.350, expect a further descend of the quotes. The movement will tend toward 112.000-111.750.
Alternatively, quotes can grow towards 112.650-112.900.


