
The EUR/USD currency pair
Technical indicators of the currency pair:
Prev Open: 1.13413
Open: 1.13473
% chg. over the last day: +0.04
Day’s range: 1.13209 – 1.13324
52 wk range: 1.1299 – 1.2557
The currency pair is showing an ambyhous technical picture. The quotes are trading in flat. Yesterday the stock markets were closed in honor of George H.W. Bush. The local support and resistance levels are 1.13200 and 1.13450. Positions should be opened from these levels. The investors are waiting for the reports from the US.
The Economic News Feed for 06.12.2018:
ADP Nonfarm Employment Change (US) – 15:15 (GMT+2)
ISM Non-Manufacturing PMI (US) – 17:00 (GMT+2)
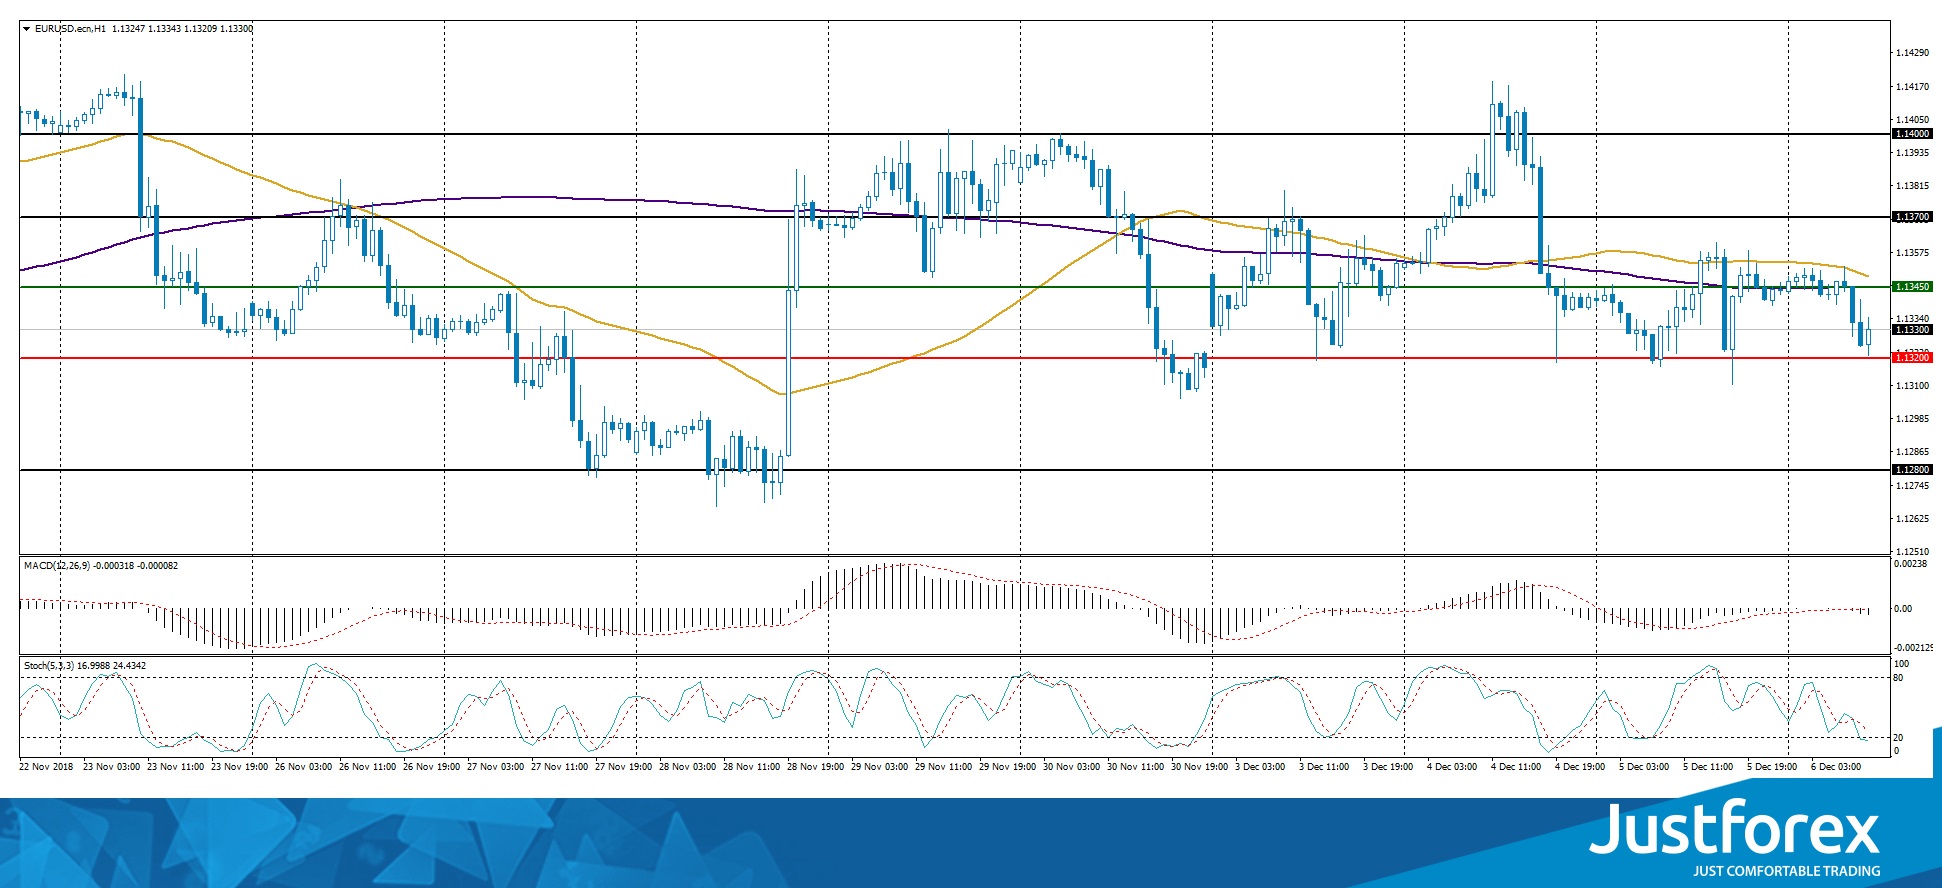
Indicators do not send accurate signals: 50 MA has crossed 200 MA.
The MACD histogram started to descend, indicating the development of the bearish sentiment.
Stochastic Oscillator is close to the oversold zone, the %K line is below the %D line, which gives a signal to sell EUR/USD.
Trading recommendations
Support levels: 1.13200, 1.12800
Resistance levels: 1.13450, 1.13700, 1.14000
If the price fixes below the support level of 1.13200, it is necessary to consider selling EUR/USD. The movement is tending to 1.12800-1.12600.
An alternative could be the recovery of the EUR/USD quotes to the level of 1.13700-1.14000.
The GBP/USD currency pair
Technical indicators of the currency pair:
Prev Open: 1.27080
Open: 1.27321
% chg. over the last day: -0.04
Day’s range: 1.26994 – 1.27328
52 wk range: 1.2662 – 1.4378
The technical pattern on the GBP/USD currency pair is still ambiguous. Yesterday the Service Sector PMI was published in the UK, which reached 50.4 instead of the expected 52.5. The quotes are testing the key support and resistance levels: 1.27000 and 1.27400. Investors keep evaluating the recent developments regarding Brexit. You should open positions from the key levels.
The Economic News Field for 06.12.2018 is calm.
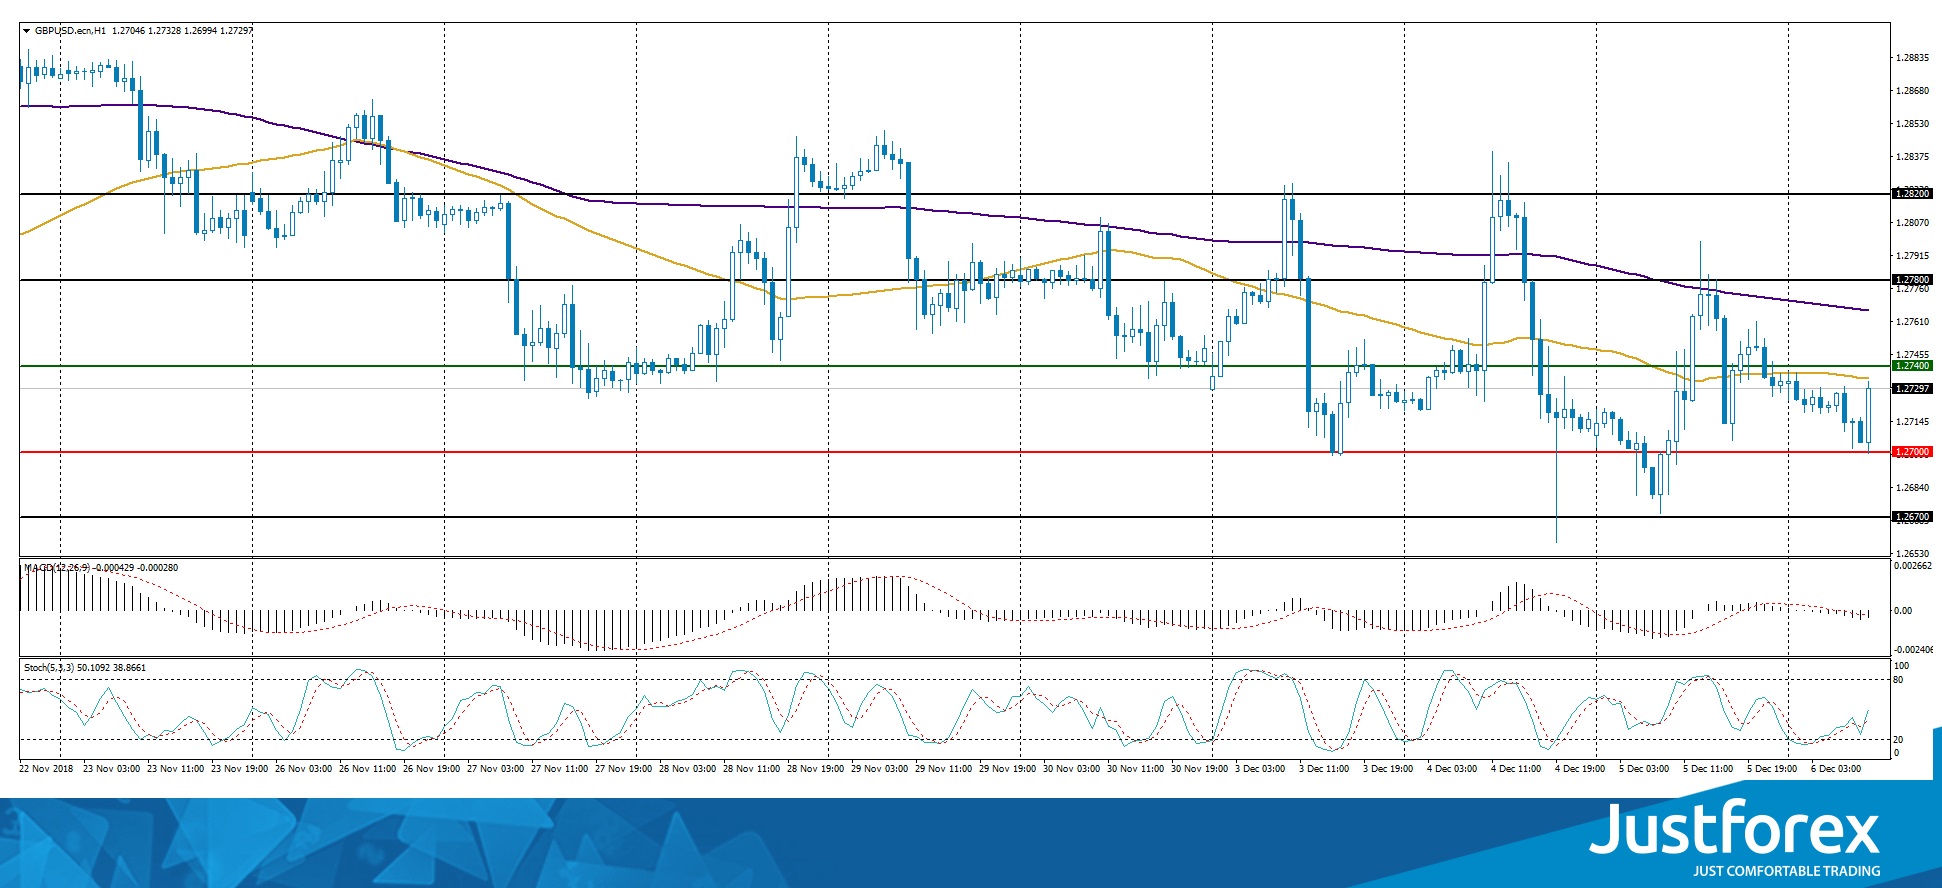
Indicator signals are ambiguous. The price has approached 50 MA, which is a strong dynamic resistance.
The MACD histogram is in the negative zone, which indicates a bearish sentiment.
Stochastic Oscillator is in the neutral zone, the %K line is crossing the %D line. There are no signals at the moment.
Trading recommendations
Support levels: 1.27000, 1.26700
Resistance levels: 1.27400, 1.27800, 1.28200
If the price fixes above the resistance level of 1.27400, the GBP/USD quotes are expected to grow. The movement is tending to 1.27800-1.28200.
An alternative could be a decrease in the GBP/USD currency pair to 1.26700-1.26500.
The USD/CAD currency pair
Technical indicators of the currency pair:
Prev Open: 1.32578
Open: 1.33528
% chg. over the last day: +0.77
Day’s range: 1.34123 – 1.32187
52 wk range: 1.2248 – 1.3387
The USD/CAD is showing aggressive purchases. During yesterday’s and today`s trading, the quotes gre by more than 150 points. The Bank of Canada left the key interest rate at 1.75% and worsened the inflation expectations forecast, which caused an aggressive sell-off of the CAD. The key support and resistance levels are 1.33900 and 1.34350. Positions should be opened from these levels. The quotes have a tendency to grow futher.
At 17:00 (GMT+2:00), Ivey will publish the PMI report.
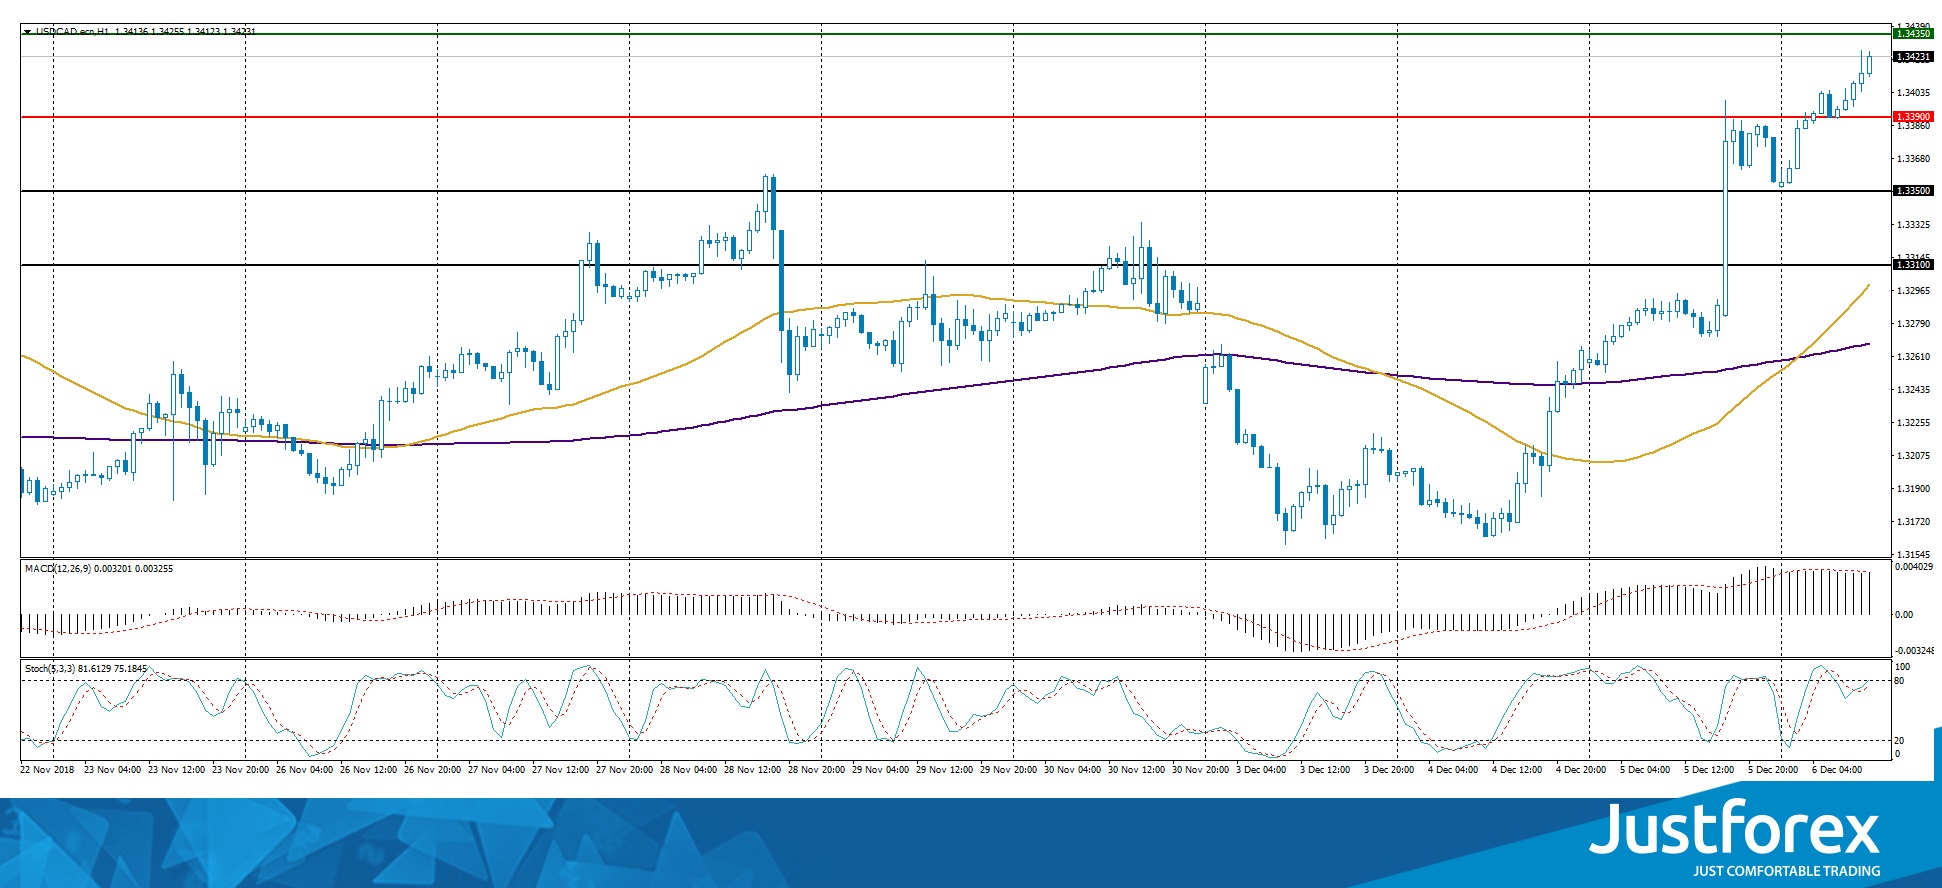
The price has fixed above 50 MA and 200 MA, which indicates the power of buyers.
The MACD histogram is in the positive zone and above the signal line, which gives a strong signal to buy USD/CAD.
The Stochastic Oscillator is in the neutral zone, the %K line is above the %D line, which indicates a drop in the USD/CAD quotes.
Trading recommendations
Support levels: 1.33900, 1.33500, 1.33100
Resistance levels: 1.34350, 1.34600
If the price fixes above the local resistance of 1.34350, further growth of the USD/CAD quotes is expected. The movement is tending to 1.34600-1.34800.
Alternative option. If the price fixes below 1.33900, we recommend looking for market entry points to open short positions. The movement is tending to 1.33600-1.33400.
The USD/JPY currency pair
Technical indicators of the currency pair:
Prev Open: 112.753
Open: 113.183
% chg. over the last day: +0.24
Day’s range: 112.687 – 112.844
52 wk range: 104.56 – 114.74
The USD/JPY is showing a variety of trends. The technical picture is ambigous. The local support and resistance levels are 112.600 and 112.850. Positions should be opened from these levels. You should keep an eye on the yield of the US Treasury bonds. The USD/JPY quotes have a downward tendency.
The news feed on the Japanese economy is calm.
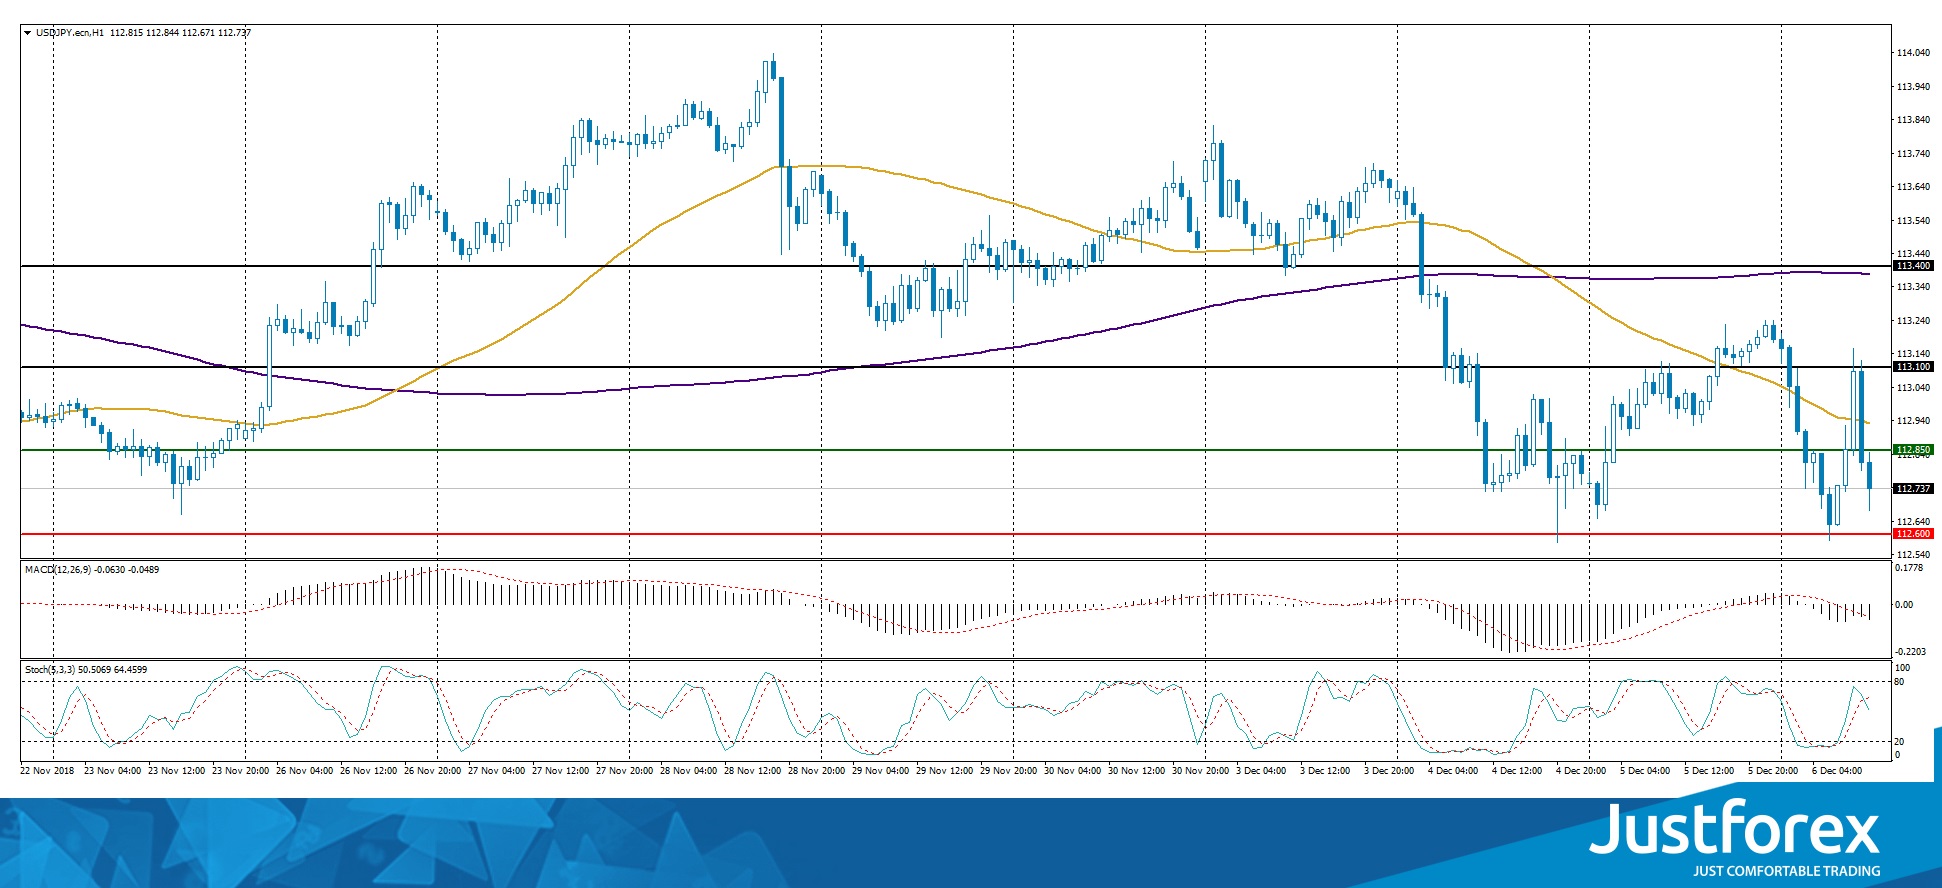
The price has fixed below 50 MA and 200 MA, which indicates the power of sellers.
The MACD histogram is in the negative zone, which indicates a bearish sentiment.
The Stochastic Oscillator is in the neutral zone, the %K line crosses the %D line. There are no signals.
Trading recommendations
Support levels: 112.600, 112.300
Resistance levels: 112.850, 113.100, 113.400
If the price fixes below the support level of 112.600, it is necessary to consider selling USD/JPY. The movement is tending to 112.300-112.000.
An alternative could be the growth of the USD/JPY quotes to 113.100-113.300.


