
The EUR/USD currency pair
Technical indicators of the currency pair:
Prev Open: 1.13907
Open: 1.13552
% chg. over the last day: -0.39
Day’s range: 1.13504 – 1.13772
52 wk range: 1.1214 – 1.2557
Yesterday the EUR/USD had a bearish mood. The EUR updated the local minimums. The EUR/USD quotes are consolidating. The local support and resistance levels are 1.13500 and 1.13750. Positions should be opened from these levels. Investors expect reports from Germany and the USA.
The Economic News Feed for 11.12.2018:
Economic Mood index ZEW (GER) – 12:00 (GMT+2:00);
Manufacturer Price Index (US) – 15:30 (GMT+2:00).
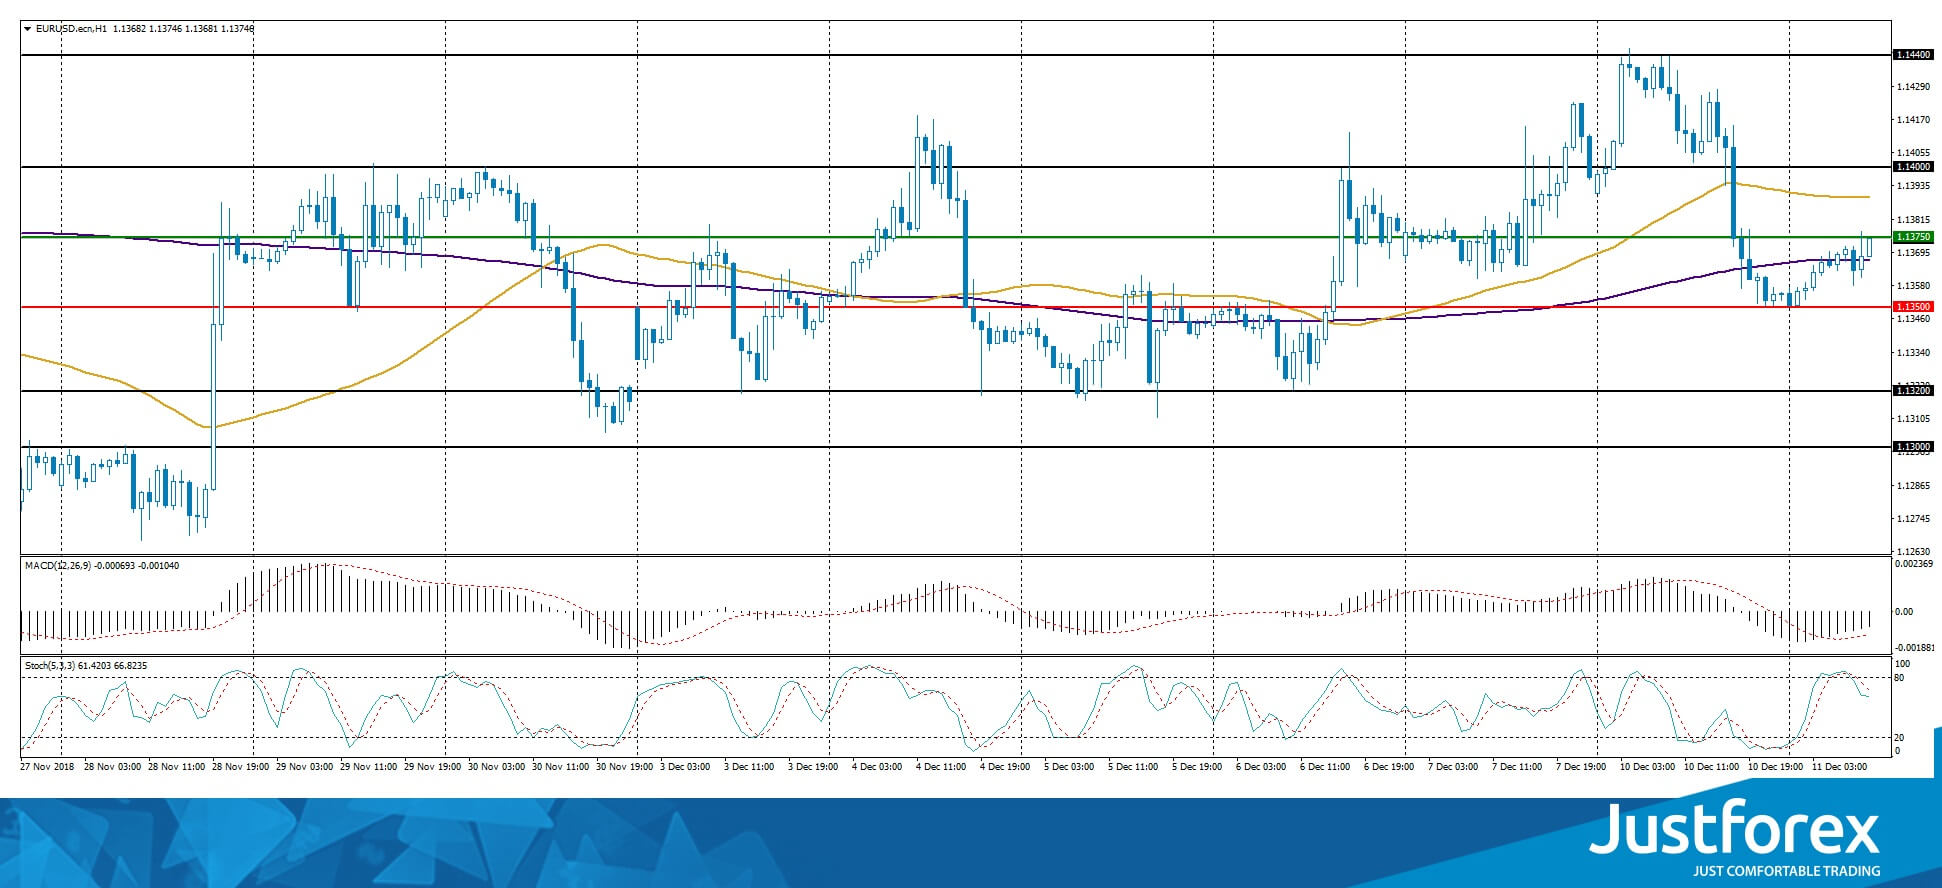
Indicators do not provide precise signals, the price fixed between 50 MA and 200 MA.
MACD is in the negative zone but above the signal line, which gives a weak signal to sell EUR/USD.
The Stochastic Oscillator is in the neutral zone but above the signal line, which indicates a bearish mood.
Trading recommendations
Support levels: 1.13500, 1.13200, 1.13000
Resistance levels: 1.13750, 1.14000, 1.14400
If the price fixes below the support 1.13500, expect further descend towards 1.13200-1.13000.
Alternatively, the quotes can recover toward 1.14000-1.14200.
The GBP/USD currency pair
Technical indicators of the currency pair:
Prev Open: 1.27022
Open: 1.25557
% chg. over the last day: -1.25
Day’s range: 1.25446 – 1.25907
52 wk range: 1.2510 – 1.4378
Yesterday the GBP/USD saw an aggressive sell-off. The quotes fell by 150 pips and updated the annual minimums. The Brexit conundrum remains in the spotlight. Theresa May announced the cancellation of the vote in the House of Commons regarding the UK leaving the European Union. An additional pressure on the GBP is cause by the array of weak economic reports regarding GDP and manufacturing industry. The quotes are being traded around 1.25600-1.26000. Positions should be opened from these levels.
At 11:30 (GMT+2:00) the UK will publish the Labour Market report.
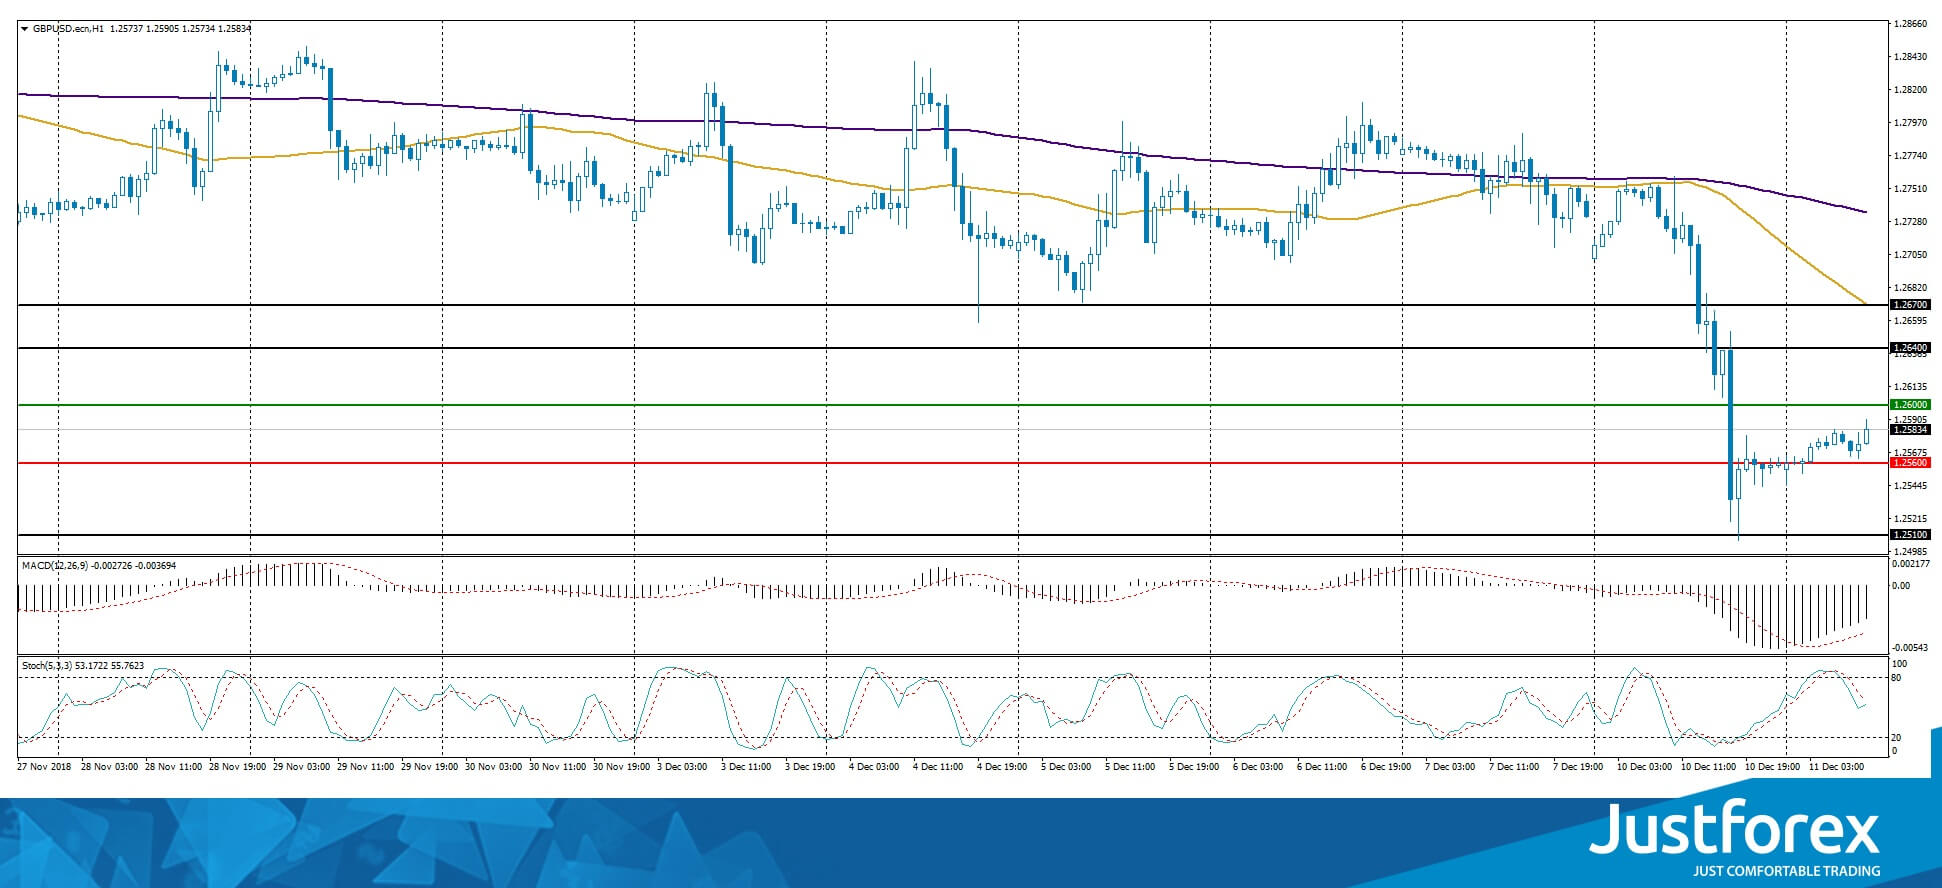
Indicators show the power of the sellers. The price is below 50 MA and 200 MA.
The MACD histogram is in the negative zone but above the signal line, which indicates a weak bearish sentiment.
Stochastic Oscillator is in the neutral zone, the %K line started to cross %D line. There are no signals at the moment.
Trading recommendations
Support levels: 1.25600, 1.25100
Resistance levels: 1.26000, 1.26400, 1.26700
If the price fixes below 1.25600, the GBP/USD quotes are expected to fall. The movement is tending to 1.25200-1.25000.
An alternative could be a growth in the GBP/USD currency pair to 1.26400-1.26700.
The USD/CAD currency pair
Technical indicators of the currency pair:
Prev Open: 1.33328
Open: 1.33986
% chg. over the last day: +0.52
Day’s range: 1.33914 – 1.34215
52 wk range: 1.2248 – 1.3445
USD/CAD started to grow again. Yesterday CAD weakened against the USD by 75 pips. The quotes are testing 1.34200-1.34450 with the local support being 1.33800. The pressure on CAD is caused by the negative dynamic of the oil quotes. The trading instrument has prospects for growth. You should open positions from the key levels.
The News Feed for Canada is calm.
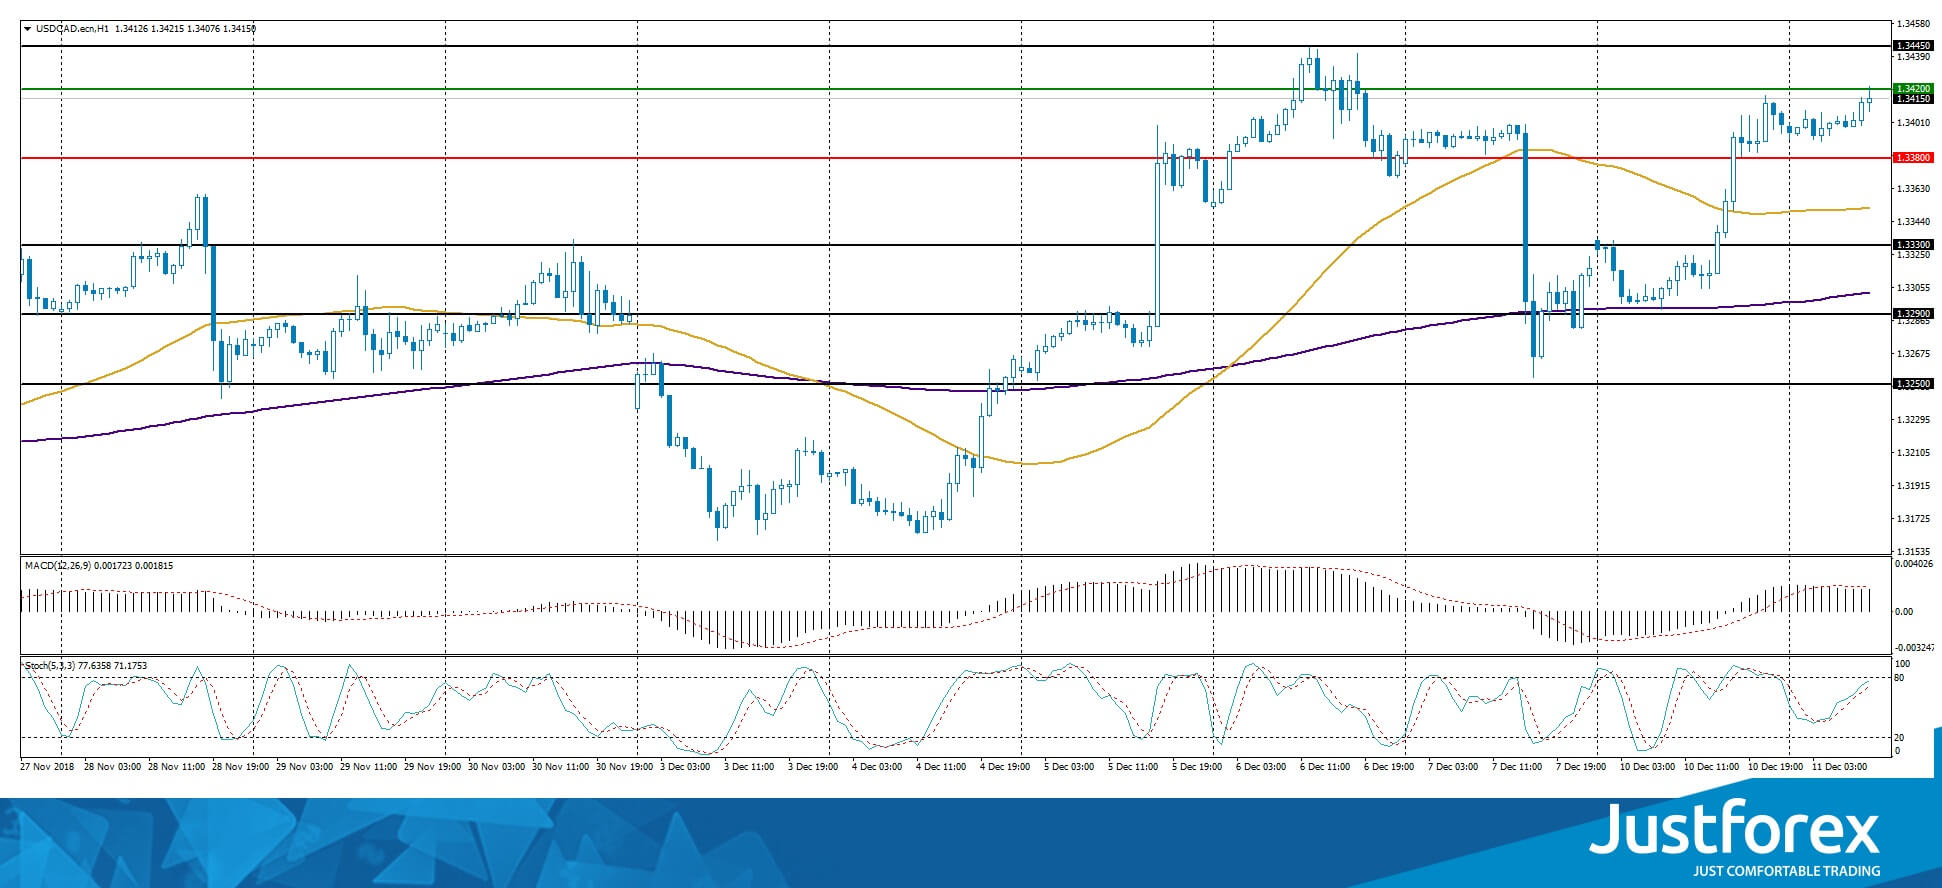
The indicators point toward the power of the buyers: the price has fixed above the 50 MA and 200 MA.
The MACD histogram is in the positive zone and keeps rising which points towards the growth of the USD/CAD quotes.
The Stochastic Oscillator is in the neutral zone, the %K line is above the %D line, which points towards the growth of the USD/CAD quotes.
Trading recommendations
Support levels: 1.33800, 1.33300, 1.32900
Resistance levels: 1.34200, 1.34450
If the price fixes below the local resistance of 1.34200, further growth of the USD/CAD quotes is expected. The movement is tending to 1.34500-1.34750.
Alternative option. If the price fixes above 1.33800, we recommend looking for market entry points to open short positions. The movement is tending to 1.33500-1.33300.
The USD/JPY currency pair
Technical indicators of the currency pair:
Prev Open: 112.613
Open: 113.317
% chg. over the last day: +0.60
Day’s range: 113.007 – 113.325
52 wk range: 104.56 – 114.56
USD/JPY started to grow. During yesterday`s trades, the yen is weakened against the USA by more than 70 pips. The USD/JPY quotes are consolidating. The local support and resistance are 112.900 and 113.200. We expect important reports from the US. You should also keep an eye on the US Government bonds yield.
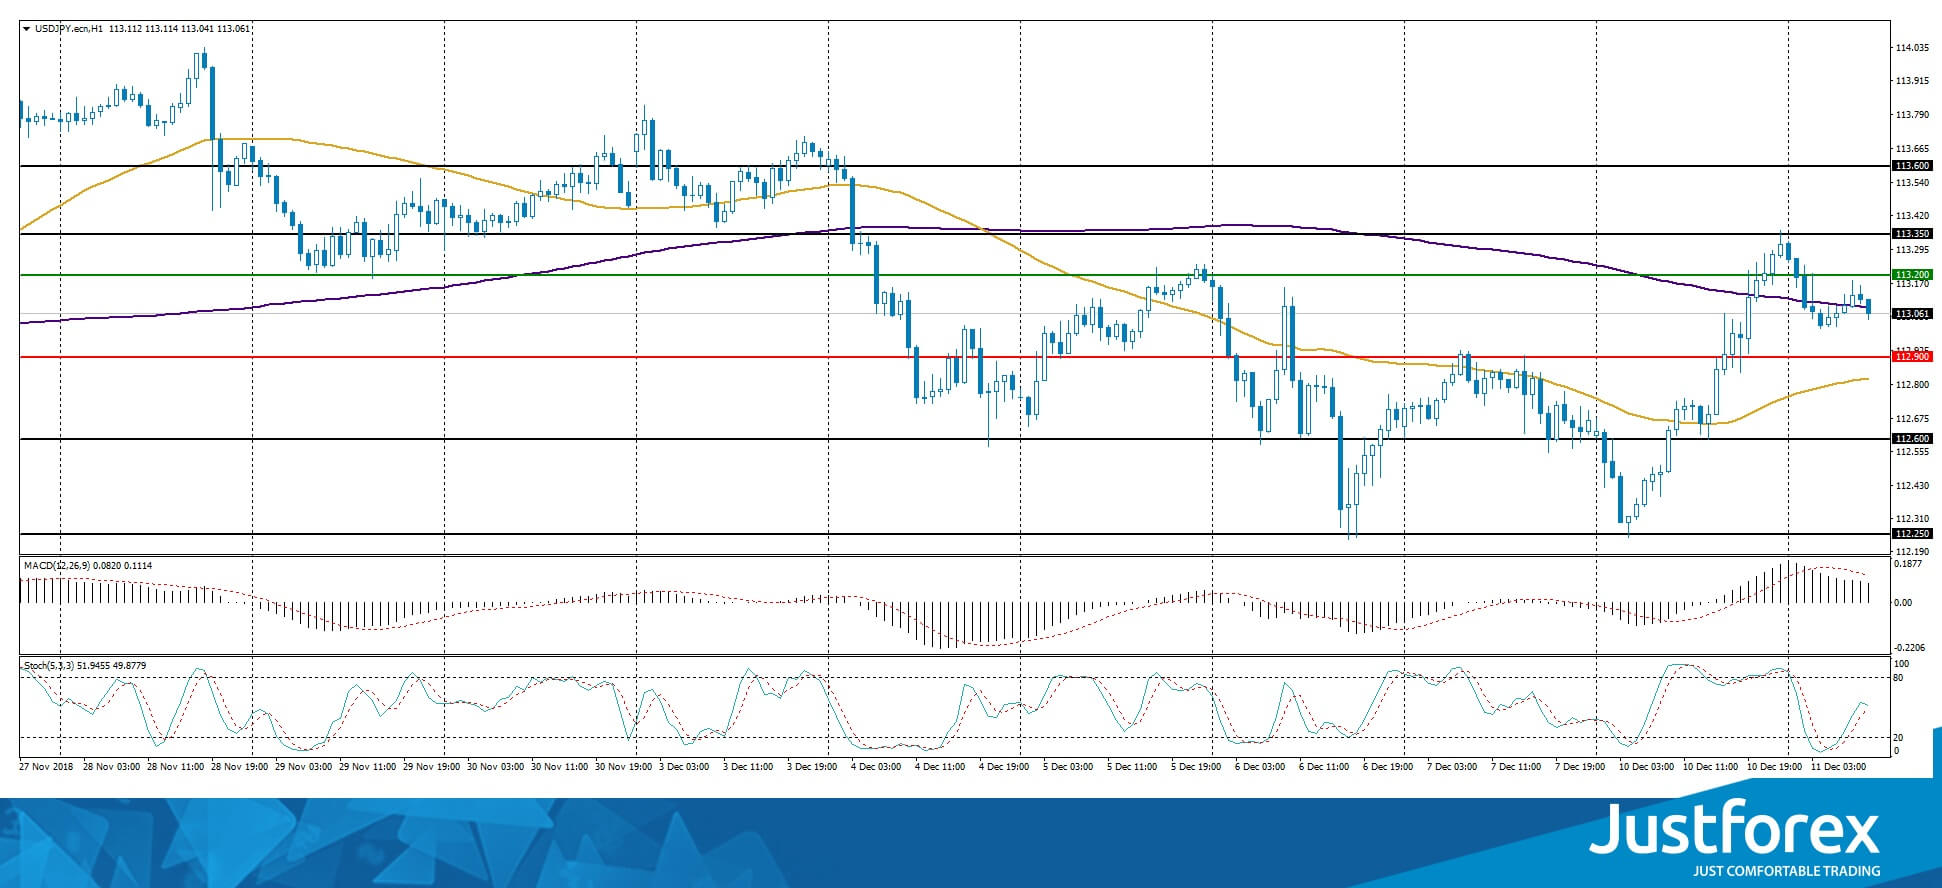
Indicators do not provide precise data, the price has crossed the 200 MA.
The MACD histogram is in the positive zone but below the signal line, which gives a weak signal to buy USD/JPY.
The Stochastic Oscillator is in the neutral zone, the %K line is above the %D line, which points towards a bullish mood.
Trading recommendations
Support levels: 112.900, 112.600, 112.250
Resistance levels: 113.200, 113.600
If the price fixes above the support level of 113.200,, it is necessary to consider buying USD/JPY. The movement is tending to 113.500-113.700.
An alternative could be the descend of the USD/JPY quotes to 112.600-112.400.


