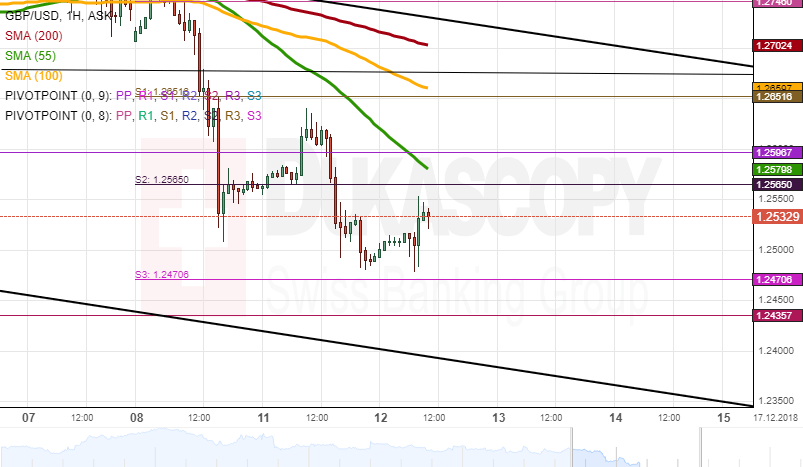
During Tuesday’s trading session, the currency exchange rate was resisted by the 55-hour SMA to pass through the support levels of the monthly S1 and the weekly S2 . During Wednesday’s morning hours, the British Pound was located between the weekly S2 and the weekly S3 to trade at the 1.2537 mark.
In regards to the near-term future, most likely, the currency exchange rate will break the resistance of the 55-hour SMA to use the technical indicator as a support level to break through the monthly S2 at 1.2565 to trade near the 1.2555 level.
On the other side, the rate could be resisted by the 55-hour simple moving average to push the British pound to pass through the support level of the monthly S2 at 1.2435 to trade at the 1.2400 level during the trading session on Wednesday.