
The EUR/USD currency pair
Technical indicators of the currency pair:
Prev Open: 1.13518
Open: 1.14305
% chg. over the last day: +0.69
Day’s range: 1.14267 – 1.14673
52 wk range: 1.1214 – 1.2557
During the last two days of trading, the USD weakened against the basket of major currencies. The EUR/USD quotes grew by 100 points. The currency is under pressure due to renewed trading disputes between the US and China, a political ambiguousness in the White House and weak economic reports. The Consumer Trust Index for December lowered to 128.1 instead of expected 133.7. The positions should be opened from the key levels of 1.14300 and 1.14650. The trading instrument has a potential for further growth.
The Economic News Feed for 28.12.2018:
Unfinished Real Estate Sales Index (US) – 17:00 (GMT+2:00);
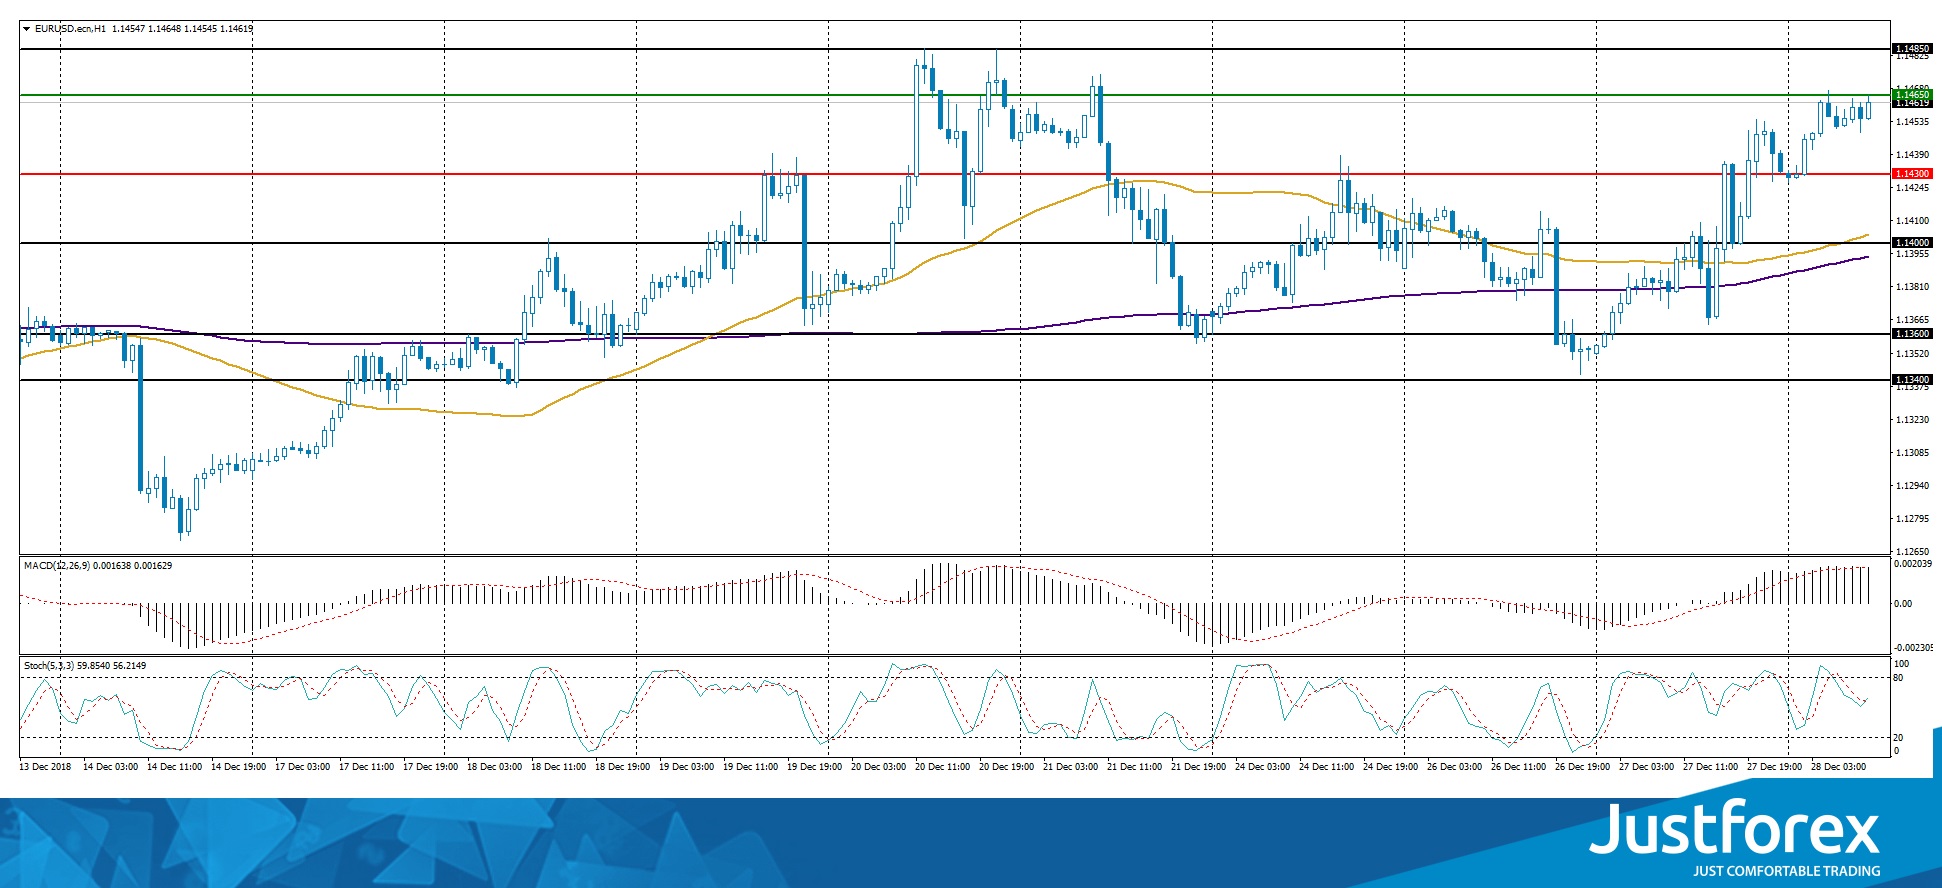
The price has fixed above 50 MA and 200 MA which points toward the power of the buyers.
The MACD histogram is in the positive zone and above the signal line, which gives a strong signal towards the purchase of EUR/USD.
The Stochastic Oscillator is in the neutral zone, the %K line is crossing the %D line. There are no signals at the moment.
Trading recommendations
Support levels: 1.14300, 1.14000, 1.13600
Resistance levels: 1.14650, 1.14850, 1.15000
If the price fixes above the resistance level of 1.14650 expect further growth of the EUR/USD toward 1.14850-1.15000.
Alternatively the quotes can descend toward 1.14200-1.14000.
The GBP/USD currency pair
Technical indicators of the currency pair:
Prev Open: 1.26311
Open: 1.26425
% chg. over the last day: +0.09
Day’s range: 1.26390 – 1.26721
52 wk range: 1.2477 – 1.4378
The GBP remains in a long flat. There is no single defined trend. The financial market participants are waiting for additional drivers. You should open positions from the key levels of 1.26300 and 1.26700, as well as keep an eye on the real estate market in the US.
The Economic News Feed for 28.12.2018 is calm.
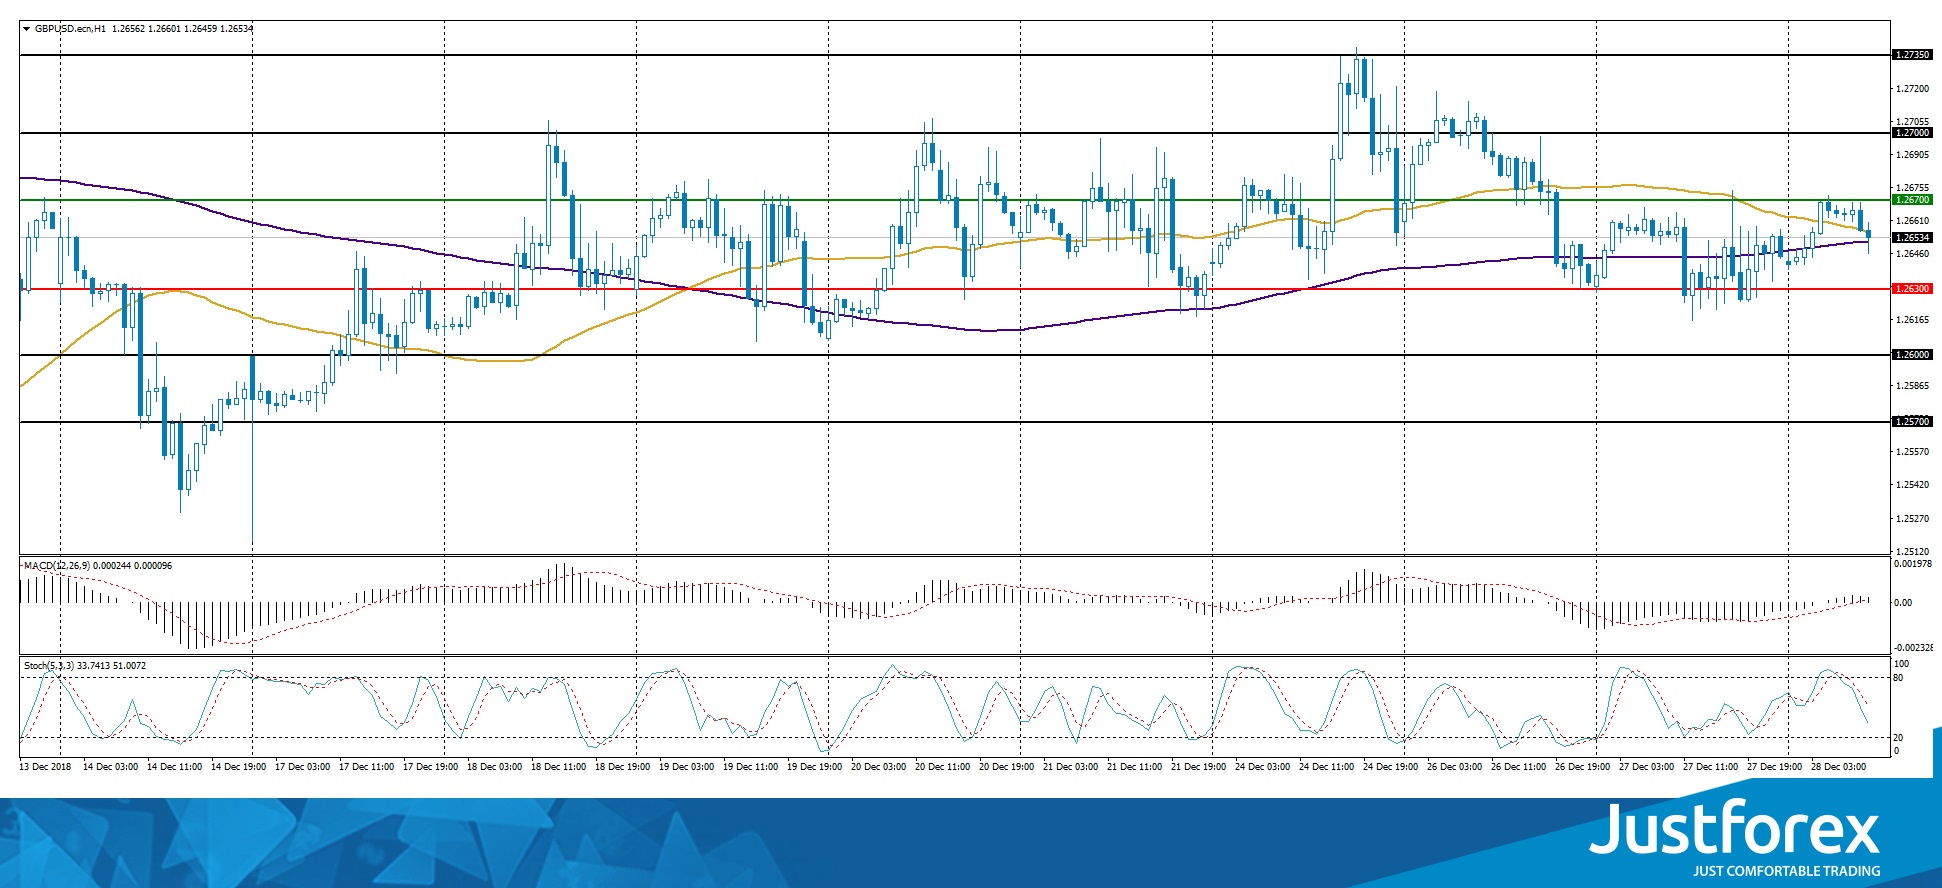
The indicators do not provide precise signals, the price has crossed 50 MA and 200 MA.
The MACD histogram is close to 0.
The Stochastic Oscillator is near the neutral zone, the %K line is below the %D line, which points toward a bearish mood.
Trading recommendations
Support levels: 1.26300, 1.26000, 1.25700
Resistance levels: 1.26700, 1.27000, 1.27350
If the price fixes above 1.26700 consider buying GBP/USD. The movement will tend toward 1.27000-1.27350.
Alternatively the quotes can descend toward 1.26000-1.25750.
The USD/CAD currency pair
Technical indicators of the currency pair:
Prev Open: 1.35679
Open: 1.36129
% chg. over the last day: +0.37
Day’s range: 1.36030 – 1.36255
52 wk range: 1.2248 – 1.4132
CAD keeps consolidating, there is no single trend. There is a possibility of a technical correction after a long rally. The key support and resistance levels are 1.35700 and 1.36250. Positions should be opened from these levels. You should keep an eye on the oil quotes dynamic.
The Economic News Feed for 28.12.2018 is calm.
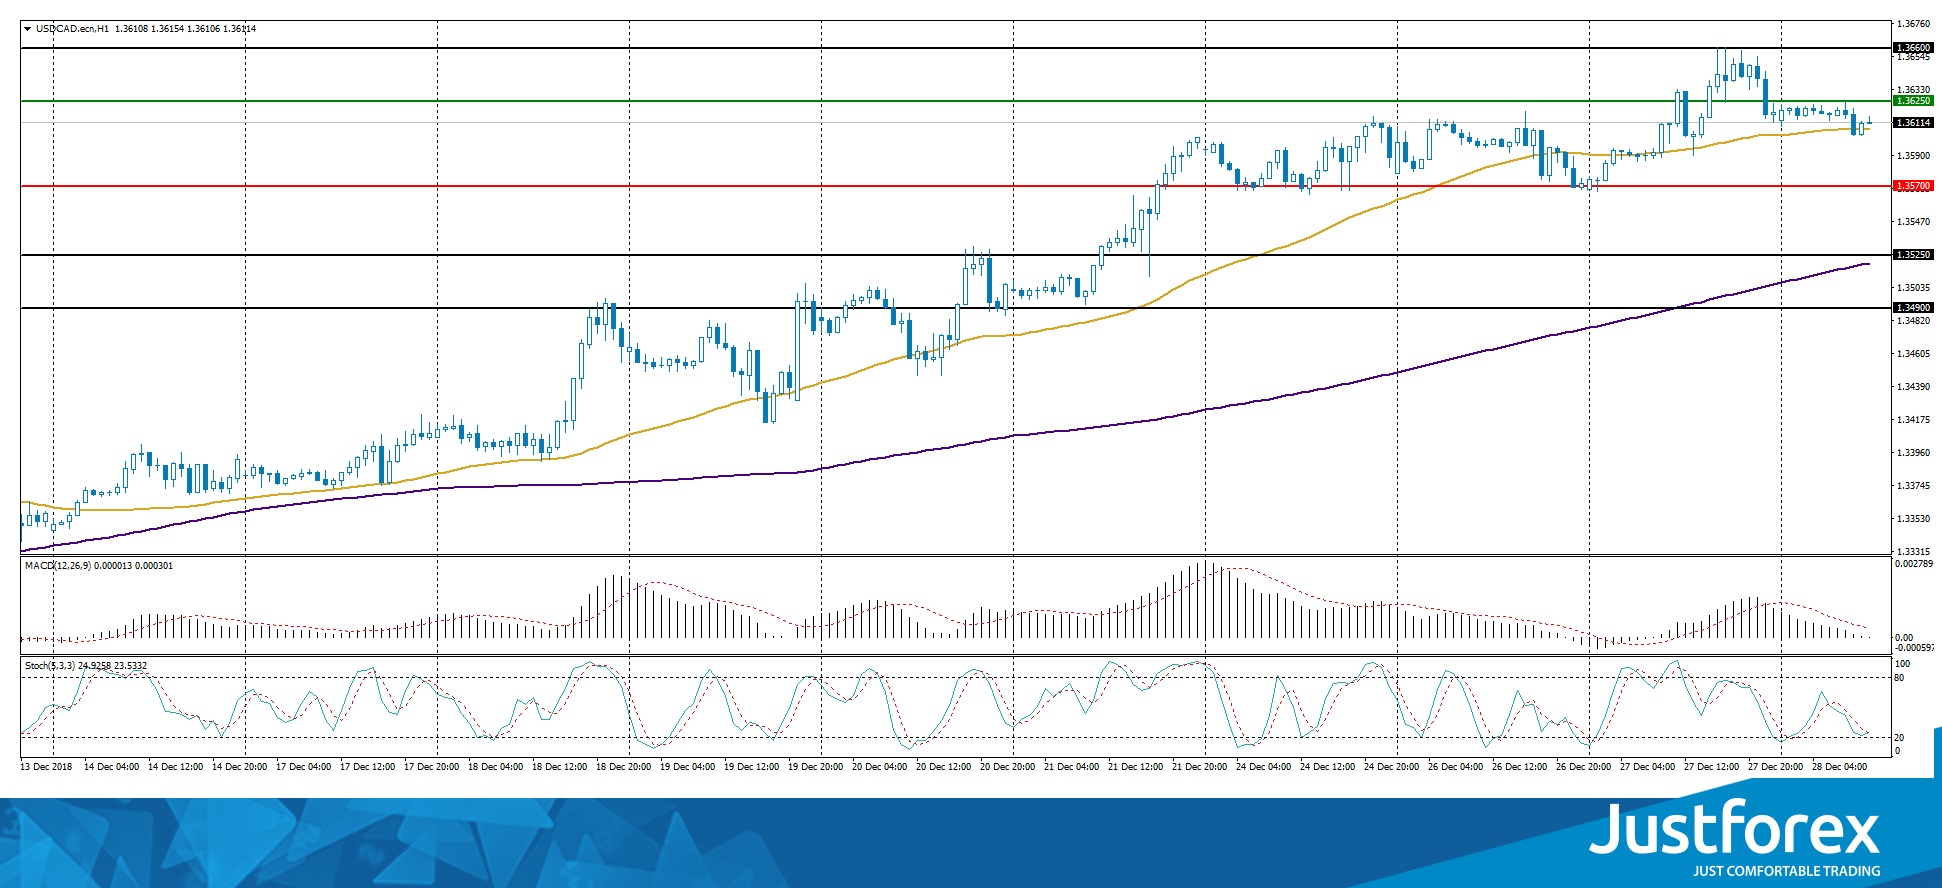
The indicators do not provide precise signals, the price has crossed 50 MA.
The MACD histogram is located close to 0.
The Stochastic Oscillator is in the neutral zone, the %K line is crossing the %D line. There are no signals at the moment.
Trading recommendations
Support levels: 1.35700, 1.35250, 1.34900
Resistance levels: 1.36250, 1.36600
If the price fixes above the resistance level of 1.36250 expect further growth of the USD/CAD quotes. The movement will tend toward 1.36600-1.36800.
Alternatively the quotes can correct toward 1.35600-1.35300.
The USD/JPY currency pair
Technical indicators of the currency pair:
Prev Open: 111.301
Open: 110.983
% chg. over the last day: -0.47
Day’s range: 110.350 – 111.011
52 wk range: 104.56 – 114.56
The USD/JPY is showing an ambiguous technical picture. The trading instrument is moving sidewards as the demand for the safe have currencies growth. The key support and resistance levels are 110.200 and 110.700. You should keep an eye on the US economic news feed and open positions form the key levels.
During the Asian trading session Japan published some ambiguous economic reports
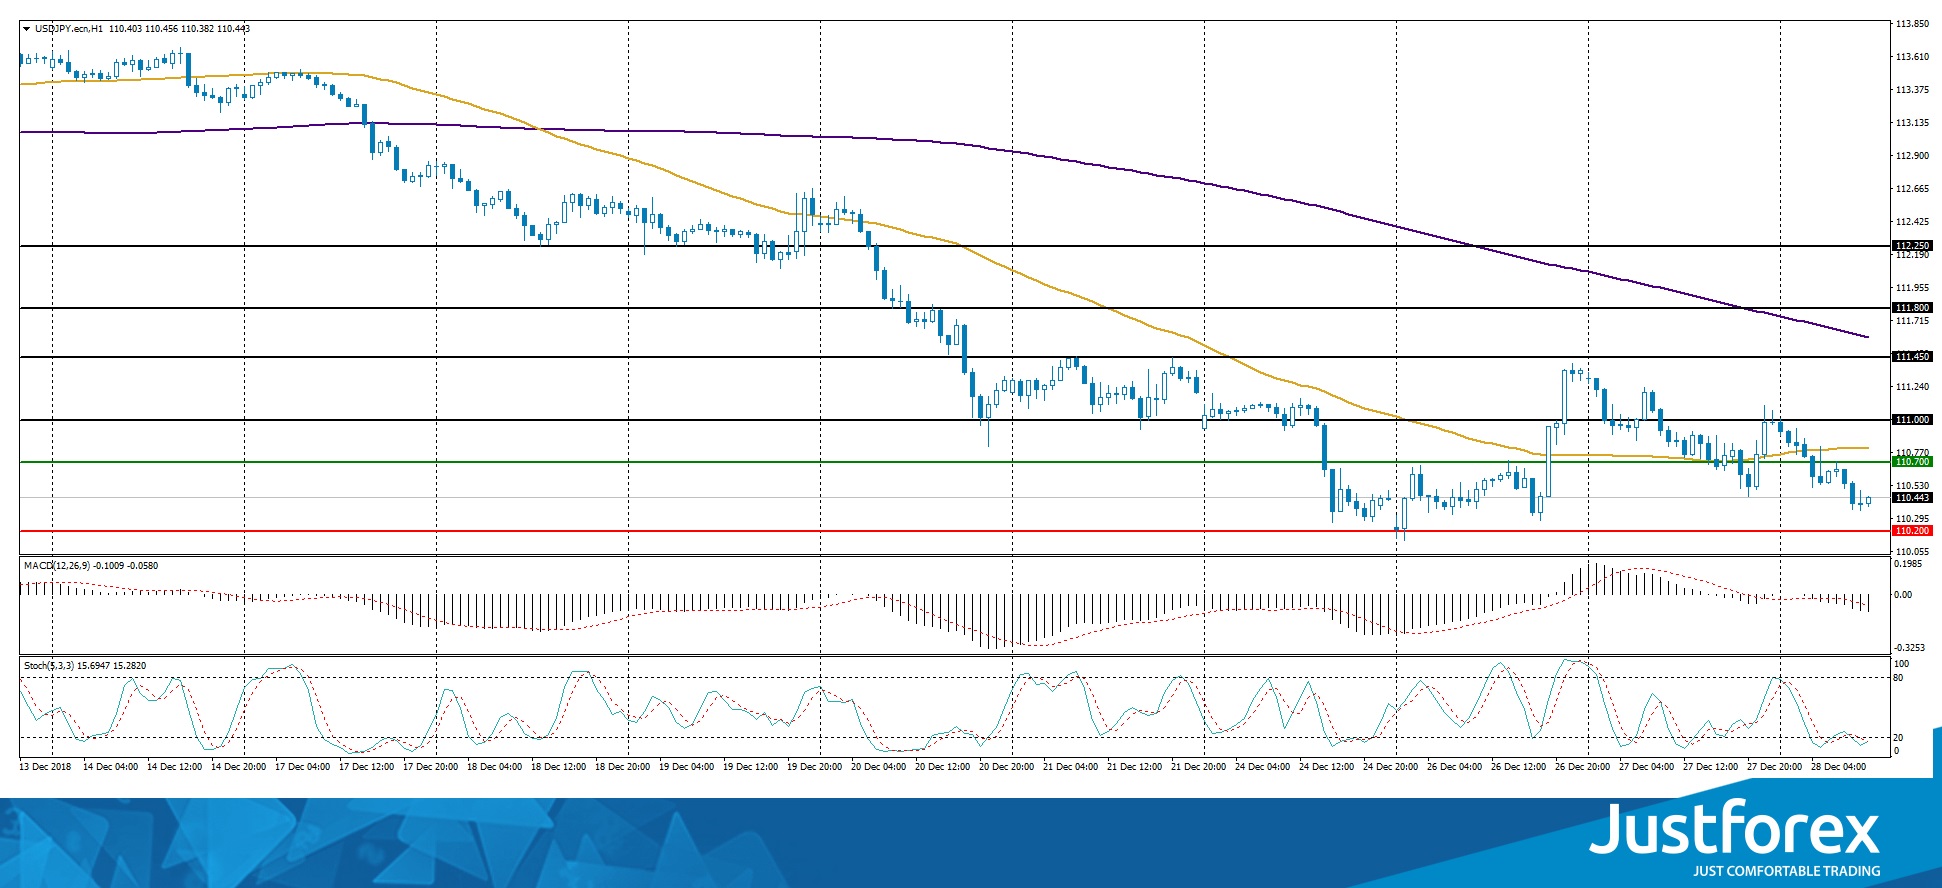
The price fixed below 50 MA and 200 MA which points toward the power of the sellers.
The MACD histogram moved to the negative zone which points toward the bearish mood.
The Stochastic Oscillator is in the oversold zone, the %K line crosses the %D line. There are no signals at the moment.
Trading recommendations
Support levels: 110.200, 110.000
Resistance levels: 110.700, 111.000, 111.450
If the price fixes above the resistance level of 110.700 expect the quotes to grow toward USD/JPY. The movement will tend toward 111.000-111.400.
Alternatively the quotes can descend toward 110.000-109.800.


