
A note on lower timeframe confirming price action…
Waiting for lower timeframe confirmation is our main tool to confirm strength within higher timeframe zones, and has really been the key to our trading success. It takes a little time to understand the subtle nuances, however, as each trade is never the same, but once you master the rhythm so to speak, you will be saved from countless unnecessary losing trades. The following is a list of what we look for:
- A break/retest of supply or demand dependent on which way you’re trading.
- A trendline break/retest.
- Buying/selling tails – essentially we look for a cluster of very obvious spikes off of lower timeframe support and resistance levels within the higher timeframe zone.
- Candlestick patterns. We tend to only stick with pin bars and engulfing bars as these have proven to be the most effective.
EUR/USD
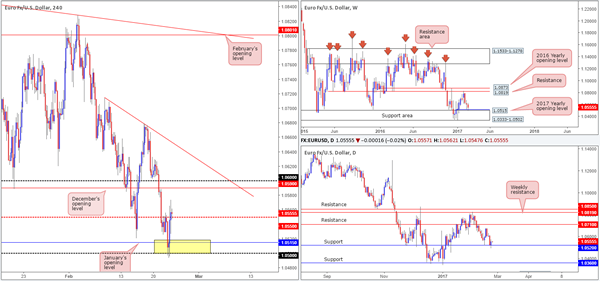
In the early hours of yesterday’s US segment, EUR bulls rose up and took charge of the 1.05 handle despite better-than-expected US housing data. Shortly after, another wave of buying came into view following the release of the FOMC minutes from the latest meeting, where rates, as expected, were left on hold.
For those who read Wednesday’s report you may recall that our desk highlighted the 1.05/1.0520 region (yellow H4 box) as an area worthy of attention. It comprises of the following structures: The 2017 yearly opening level at 1.0515, a daily support at 1.0520, the 1.05 handle and the top edge of a weekly support area at 1.0502. There was, as you can see, a very tasty H4 buying tail that formed within the walls of this region, but the candle unfortunately closed below 1.0515. As such, there was a chance that this level could’ve acted as a resistance, so we passed on the setup. Well done to any of our readers who managed to pin down a position here!
Our suggestions: With the H4 mid-level number 1.0550 now providing support to the market, price could potentially continue advancing north today until we cross swords with December’s opening base at 1.0590/the 1.06 handle. On account of the higher-timeframe structures now in motion, a long trade from 1.0550 may be something to consider. However, we would strongly recommend waiting for a lower-timeframe confirming setup to form here (see the top of this report) before pulling the trigger. This will help avoid both an unnecessary loss and the dreaded fakeout.
Data points to consider: US Jobless claims at 1.30pm, FOMC member Kaplan speaks at 6pm GMT.
Levels to watch/live orders:
- Buys: 1.0550 region ([wait for a lower-timeframe confirming signal to form before looking to execute a trade] stop loss: dependent on where one confirms this area).
- Sells: Flat (stop loss: N/A).
GBP/USD
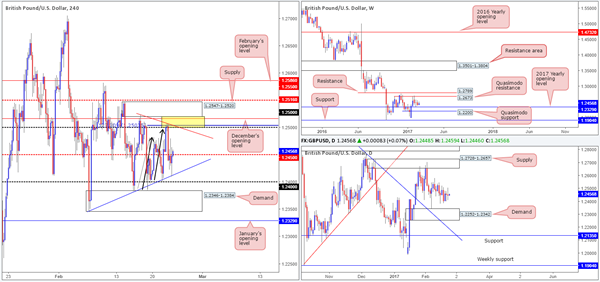
In Wednesday’s report our team underscored the 1.2520/1.25 H4 zone (yellow box) as a strong area of resistance. The zone was supported by the following structures: H4 bearish AB=CD (black arrows) 127.2% ext. at 1.2503, December’s opening level at 1.2516, the 1.25 handle and the underside of a H4 supply coming in at 1.2547-1.2520. As is evident from the chart, the pair responded beautifully from here! Well done to any of our readers who managed to net some green pips on the basis of this trade call.
Going forward, the H4 candles appear to be compressing amid two converging H4 trendlines (1.2523/1.2346).
Seeing as how the unit lacks higher-timeframe (structural) direction at present, we still favor the 1.2520/1.25 H4 zone. Only this time, we (as of yet) do not have a H4 AB=CD approach, we instead have a H4 trendline resistance!
Our suggestions: As of current prices, the bears seem to be getting squeezed around the H4 mid-level number 1.2450. A H4 close above this hurdle could see price attempt to approach the aforementioned H4 sell zone. Assuming one shorts this area at market, stop-loss orders should ideally be placed above the H4 mid-way resistance at 1.2550. For the more conservative traders out there, you may want to consider waiting for additional confirmation in the form of a reasonably sized H4 bearish candle. This would, in effect, give you the choice of either placing stops above the trigger candle or beyond the current H4 supply.
Data points to consider: US Jobless claims at 1.30pm, FOMC member Kaplan speaks at 6pm GMT.
Levels to watch/live orders:
- Buys: Flat (stop loss: N/A).
- Sells: 1.2520/1.25 ([wait for a H4 bear candle to form before pulling the trigger] stop loss: ideally beyond the trigger candle or above the current H4 supply zone/ H4 mid-way resistance at 1.2550).
AUD/USD
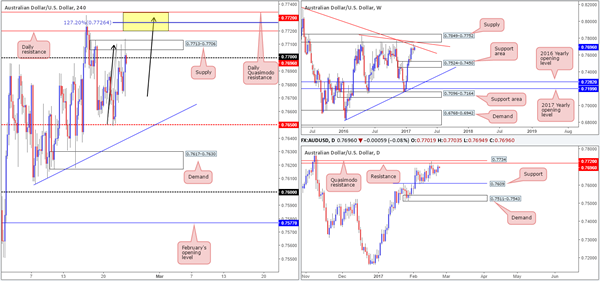
Kicking this morning’s report off with a quick look at the weekly chart shows that price remains teasing the underside of a weekly trendline resistance taken from the high 0.8163. The other key thing to note here is that a few pips above this line is a weekly supply zone marked at 0.7849-0.7752, which happens to merge with a weekly trendline resistance extended from the high 0.7835. Moving down a level to the daily chart, daily price is currently seen trading within striking distance of a daily resistance at 0.7720/daily Quasimodo resistance at 0.7734.
Swinging over to the H4 chart, the commodity currency received a boost to the upside during yesterday’s US session following the FOMC meeting. What is quite notable from a technical perspective is that price aggressively pushed above both the 0.77 handle and the H4 supply coming in at 0.7713-0.7706. Although price is now seen trading back below 0.77 at the moment, buy stops above the H4 supply zone have very likely been weakened.
Our suggestions: On the assumption that price will attempt to trade above the current H4 supply today, the next hurdle on the horizon is the aforementioned daily resistance, followed closely by the daily Quasimodo resistance (see yellow H4 box) that converges with the weekly trendline resistance (0.8163). In addition to this, we also have a potential H4 AB=CD formation in play taken from the low 0.7650 (see black arrows), which terminates around the 0.7726 neighborhood – the center of the above noted H4 yellow box!
While a short from the H4 yellow zone is tempting, one must remain cognizant of the H4 161.8% Fib ext. level at 0.7747 (not seen on the screen). This level connects beautifully with the underside of the weekly supply zone mentioned above at 0.7752. Therefore, there’s a chance that price could ignore the H4 yellow zone and head higher before selling off. So, waiting for additional confirmation within the H4 yellow zone is advised (a reasonably sized H4 bear candle should suffice).
Data points to consider: Australian private capital expenditure at 12.30am, RBA Gov. Lowe speaks at 10.30pm. US Jobless claims at 1.30pm, FOMC member Kaplan speaks at 6pm GMT.
Levels to watch/live orders:
- Buys: Flat (stop loss: N/A).
- Sells: 0.7734/0.7720 ([wait for a H4 bear candle to form before pulling the trigger] stop loss: ideally beyond the trigger candle). 0.7747 region ([wait for a H4 bear candle to form before pulling the trigger] stop loss: ideally beyond the trigger candle).
USD/JPY
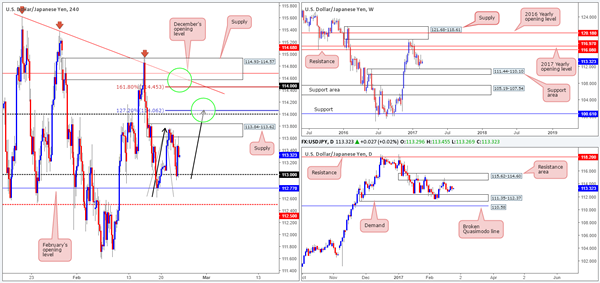
As of current price, the H4 candles are seen loitering mid-range between a H4 supply zone visible at 113.84-113.62 and a psychological support drawn from 113. To make a long story short, the main interest here is the 114 handle seen above the current H4 supply, and the H4 supply seen above this at 114.93-114.57.
Here’s why:
With the 114 handle sitting directly above the current H4 supply, there is a good chance that this will act as a magnet to price and therefore fake above the H4 supply zone. In addition to this, there’s a possible H4 AB=CD bearish formation in play taken from the low 112.63 that terminates just above 114 at 114.06 (the H4 AB=CD 127.2% Fib ext.).
The H4 supply seen at 114.93-114.57 is also interesting. Supporting a bounce from this zone is a H4 161.8% Fib ext. at 114.53 (taken from the AB=CD formation highlighted above), a H4 trendline resistance from the high 115.62, December’s opening level at 114.68 and it is also situated within the lower limits of a daily resistance area drawn from 115.62-114.60.
Our suggestions: On account of the above, we will be watching both zones carefully today. However, we must point out that in order for a trade to be permitted around the 114 level, it must be accompanied by a lower-timeframe confirming signal (see the top of this report). As for the H4 supply above, we would, dependent on time of day, look to short from here at market with stops placed above the H4 supply around the 114.95 mark.
Data points to consider: US Jobless claims at 1.30pm, FOMC member Kaplan speaks at 6pm GMT.
Levels to watch/live orders:
- Buys: Flat (stop loss: N/A).
- Sells: 114 region ([wait for a lower-timeframe confirming signal to form before looking to execute a trade] stop loss: dependent on where one confirms this area).114.93-114.45 region ([an area one could possibly look to short at market] stop loss: ideally beyond the H4 supply zone at 114.95).
USD/CAD
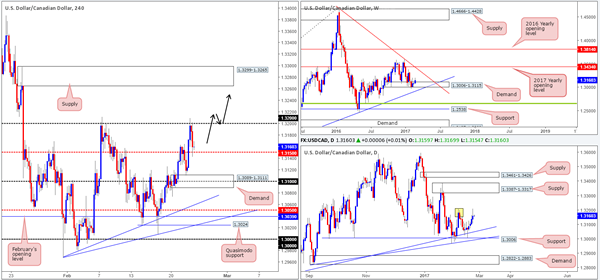
Going into the early hours of yesterday’s US session, the pair received a boost to the upside as Canadian retail sales came in lower than expected. The rally, however, was a short-lived one as the buyers failed to sustain gains beyond the 1.32 psychological handle, which eventually led to a selloff from here following the release of the FOMC minutes from the latest meeting.
In view of weekly price seen trading from a weekly demand base at 1.3006-1.3115, further upside could still be on the cards. Before this can be achieved, nevertheless, daily price would need to consume the 1.3212 neighborhood (yellow box – 7th February high).
Our suggestions: A H4 close above 1.32 today would be interesting. This would not only further confirm upside strength from the weekly demand base, but it would also possibly open up the gates for price to challenge the H4 supply coming in at 1.3299-1.3265 (positioned just beneath a daily supply area drawn from 1.3387-1.3317 – the next upside target on the daily chart after the 1.3212 region).
To take advantage of this potential move, waiting for price to retest 1.32 and chalk in a reasonably sized H4 bull candle would, at least in our opinion, be the better path to take here.
Data points to consider: Crude oil inventories at 4pm. US Jobless claims at 1.30pm, FOMC member Kaplan speaks at 6pm GMT.
Levels to watch/live orders:
- Buys: Watch for a H4 close above 1.32 and then look to trade any retest seen thereafter ([waiting for a reasonably sized H4 bull close to form following the retest is advised] stop loss: ideally beyond the trigger candle).
- Sells: Flat (stop loss: N/A).
USD/CHF
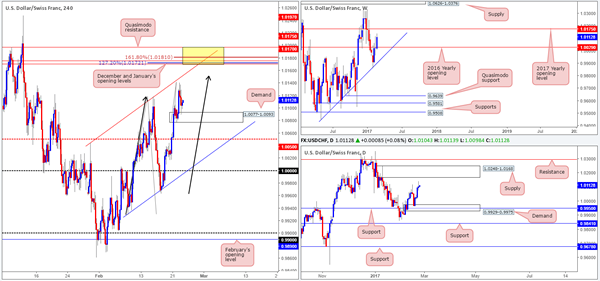
Trade update: stopped at 1.0125. See Wednesday’s report for details).
The pair began the session robustly, though one price struck highs of 1.0140 it spent the rest of the day receding lower. As you can see, the H4 demand at 1.0077-1.0093 is currently supporting this market which could, given that there is room to move north on both the weekly and the daily charts (up to the 2017 yearly opening level at 1.0175/ daily supply at 1.0248-1.0168), eventually see the bulls take things higher from here.
This begs the question, would we consider a buy from this angle? While there is, technically speaking, little wrong with this zone, we have our eyes on the 1.0197/1.0170 neighborhood for a sell. This area brings together a collection of noteworthy resistances:
- A H4 channel resistance extended from the high 1.0044.
- A H4 Quasimodo resistance at 1.0197.
- December and January’s opening levels at 1.0175/1.0170.
- A potential H4 AB=CD (see black arrows) 127.2% ext. at 1.0172.
- A minor H4 161.8% Fib ext. taken from the low 1.0077 at 1.0181.
- Located within the lower limits of a daily supply zone coming in at 1.0248-1.0168.
Our suggestions: In light of the strong confluence noted above, our desk has set a pending sell order at 1.0170 with a stop placed 5 pips above 1.02.
Data points to consider: US Jobless claims at 1.30pm, FOMC member Kaplan speaks at 6pm GMT.
Levels to watch/live orders:
- Buys: Flat (stop loss: N/A).
- Sells: 1.0170 ([pending order] stop loss: 1.0205).
DOW 30
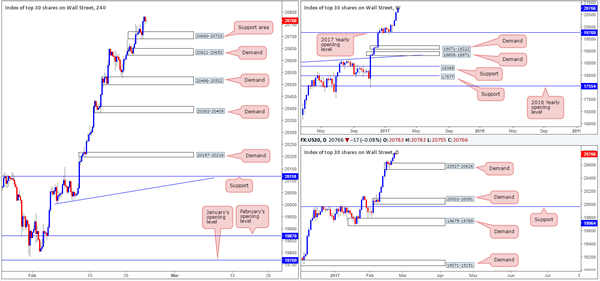
In recent sessions, US equities closed higher for a third consecutive day, tapping fresh record highs of 20790.
With absolutely no higher-timeframe resistance levels in sight, the best we feel we can do for the time being is continue looking to ‘buy the dips’. The nearest higher-timeframe area can be seen at 20527-20626: a newly-formed daily demand.
Our suggestions: The next area of support on the H4 chart, however, now falls in at 20690-20720. While this zone boasts no higher-timeframe (structural) convergence, we feel it is still worthy of attention simply because it was formed in line with the current uptrend. Just to be clear here though, placing pending orders at this zone is not advised, since there’s little stopping price from ignoring this area and heading to the H4 demand zone below at 20621-20650, which happens to be positioned around the top edge of the current daily demand base. Waiting for additional confirmation such as a lower-timeframe buy signal (see the top of this report) or a reasonably sixed H4 bull candle would, at least in our opinion, be the safer, more logical, path to take.
Data points to consider: US Jobless claims at 1.30pm, FOMC member Kaplan speaks at 6pm GMT.
Levels to watch/live orders:
- Buys: 20690-20720 ([waiting for additional confirmation is advised before looking to execute a trade] stop loss: dependent on how one chooses to confirm the zone).
- Sells: Flat (stop loss: N/A).
GOLD
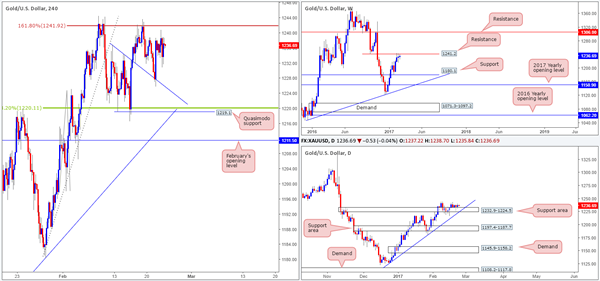
Gold has been a rather monotonous market to monitor so far this week. The weekly candles, although price is effectively now capped by a weekly resistance level at 1241.2, show little direction at present. This likely has something to do with daily buyers seen defending the daily support area coming in at 1232.9-1224.5, which happens to be bolstered by a daily trendline support etched from the low 1127.2.
Looking over to the H4 chart, we can see that price remains trading between a H4 trendline support taken from the high 1236.8 and a H4 161.8 % Fib ext. level at 1241.9. This – coupled with the higher-timeframe structures in place, leaves traders in somewhat of a precarious position: buy from the daily support area/H4 trendline support into potential weekly sellers, or sell from the weekly level of resistance/H4 161.8 % Fib ext. into possible daily buyers.
Our suggestions: In the absence of clearer price action, opting to stand on the sidelines today may very well be the better path to take.
Levels to watch/live orders:
- Buys: Flat (stop loss: N/A).
- Sells: Flat (stop loss: N/A).


