
The EUR/USD currency pair
Technical indicators of the currency pair:
Prev Open: 1.13603
Open: 1.13644
% chg. over the last day: +0.02
Day’s range: 1.13500 – 1.13636
52 wk range: 1.1214 – 1.2557
EUR/USD overview
The Economic News Feed for 22.01.2019:
Economic mood index ZEW (GER) – 12:00 (GMT+2:00);
Secondary Real Estate Sales (US) – 17:00 (GMT+2:00).
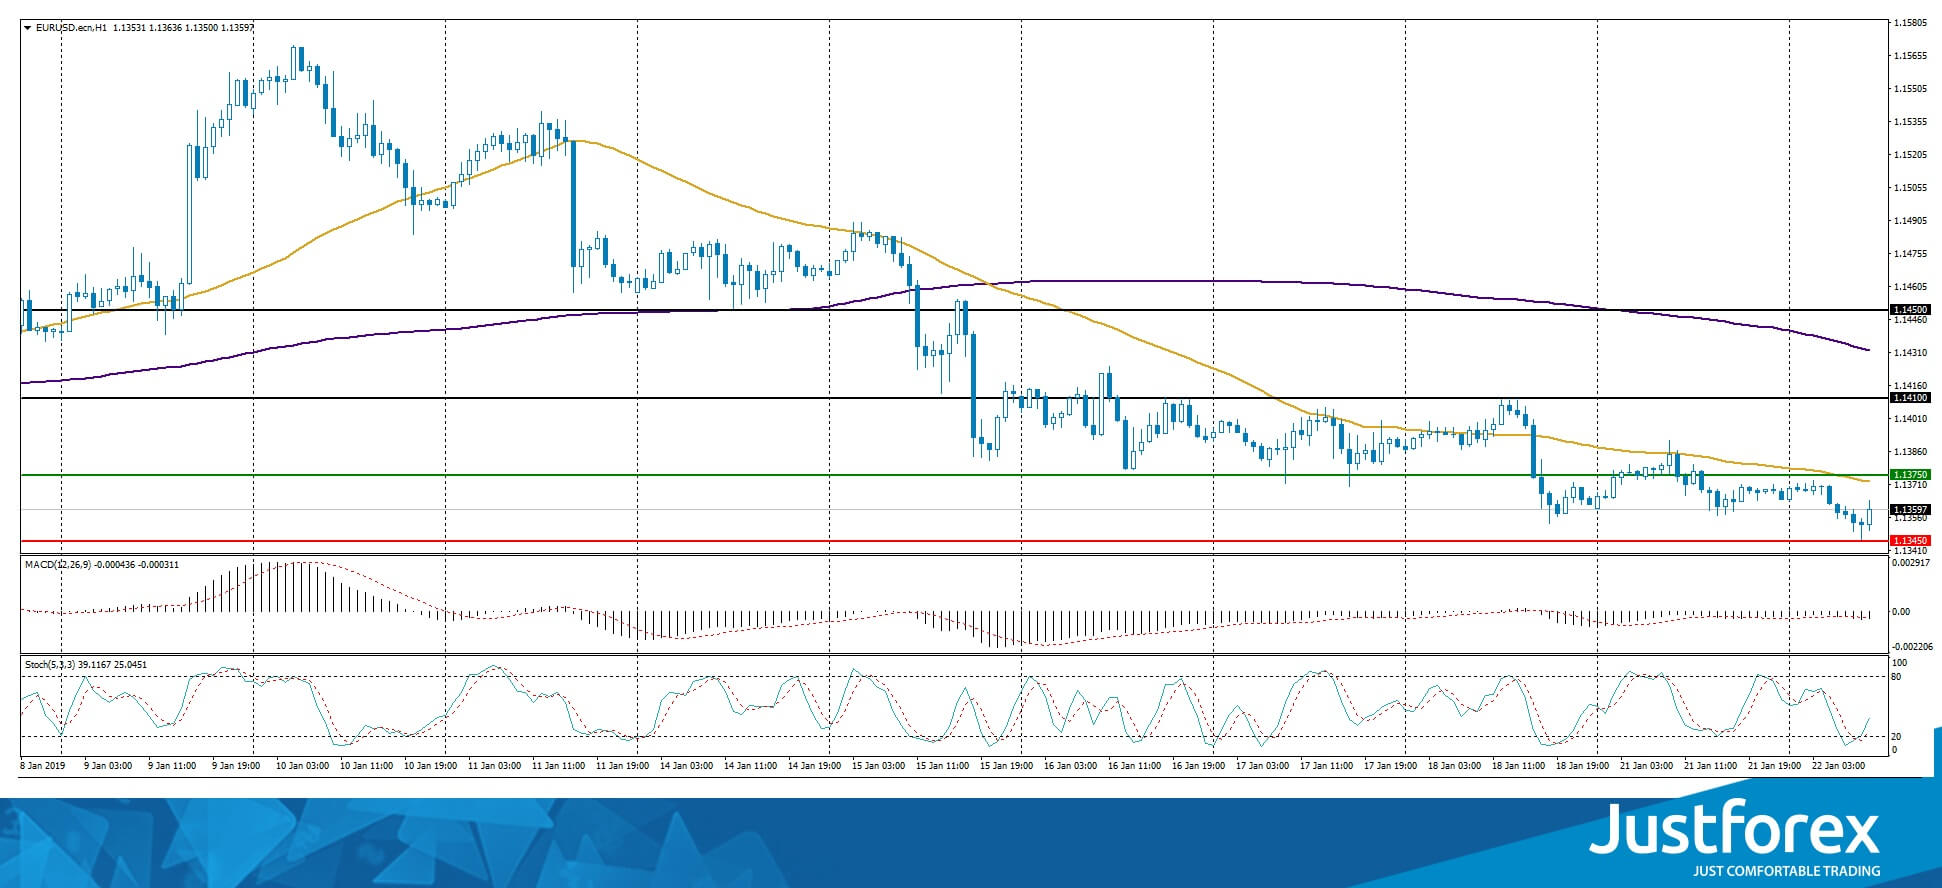
Indicator point to the power of the sellers, the price fixed below 50 MA and 200 MA.
The MACD histogram is in the negative zone, which gives a weak signal to sell EUR/USD
The Stochastic Oscillator is in the neutral zone, the %K line is above the %D line which points to the bullish mood.
Trading recommendations
Support levels: 1.13450, 1.13100
Resistance levels: 1.13750, 1.14100, 1.14500
If the price fixes below 1.13450 mark, consider selling EUR/USD. The movement will tend toward 1.13100-1.12900
Alternatively, the quotes can grow toward 1.14100-1.14300.
The GBP/USD currency pair
Technical indicators of the currency pair:
Prev Open: 1.28766
Open: 1.28911
% chg. over the last day: +0.30
Day’s range: 1.28832 – 1.28902
52 wk range: 1.2438 – 1.4378
Yesterday GBP/USD was in a bullish mood. The GBP received support after Theresa May attempted to resolve the Brexit conundrum and asked the EU for more leniency. Right now the price is testing the key resistance at 1.29000, with the key support being 1.28600. You should open positions from these levels. The trading instrument has prospects for further growth.
At 11:30 (GMT +2:00) the UK will publish the Labour Market reports.
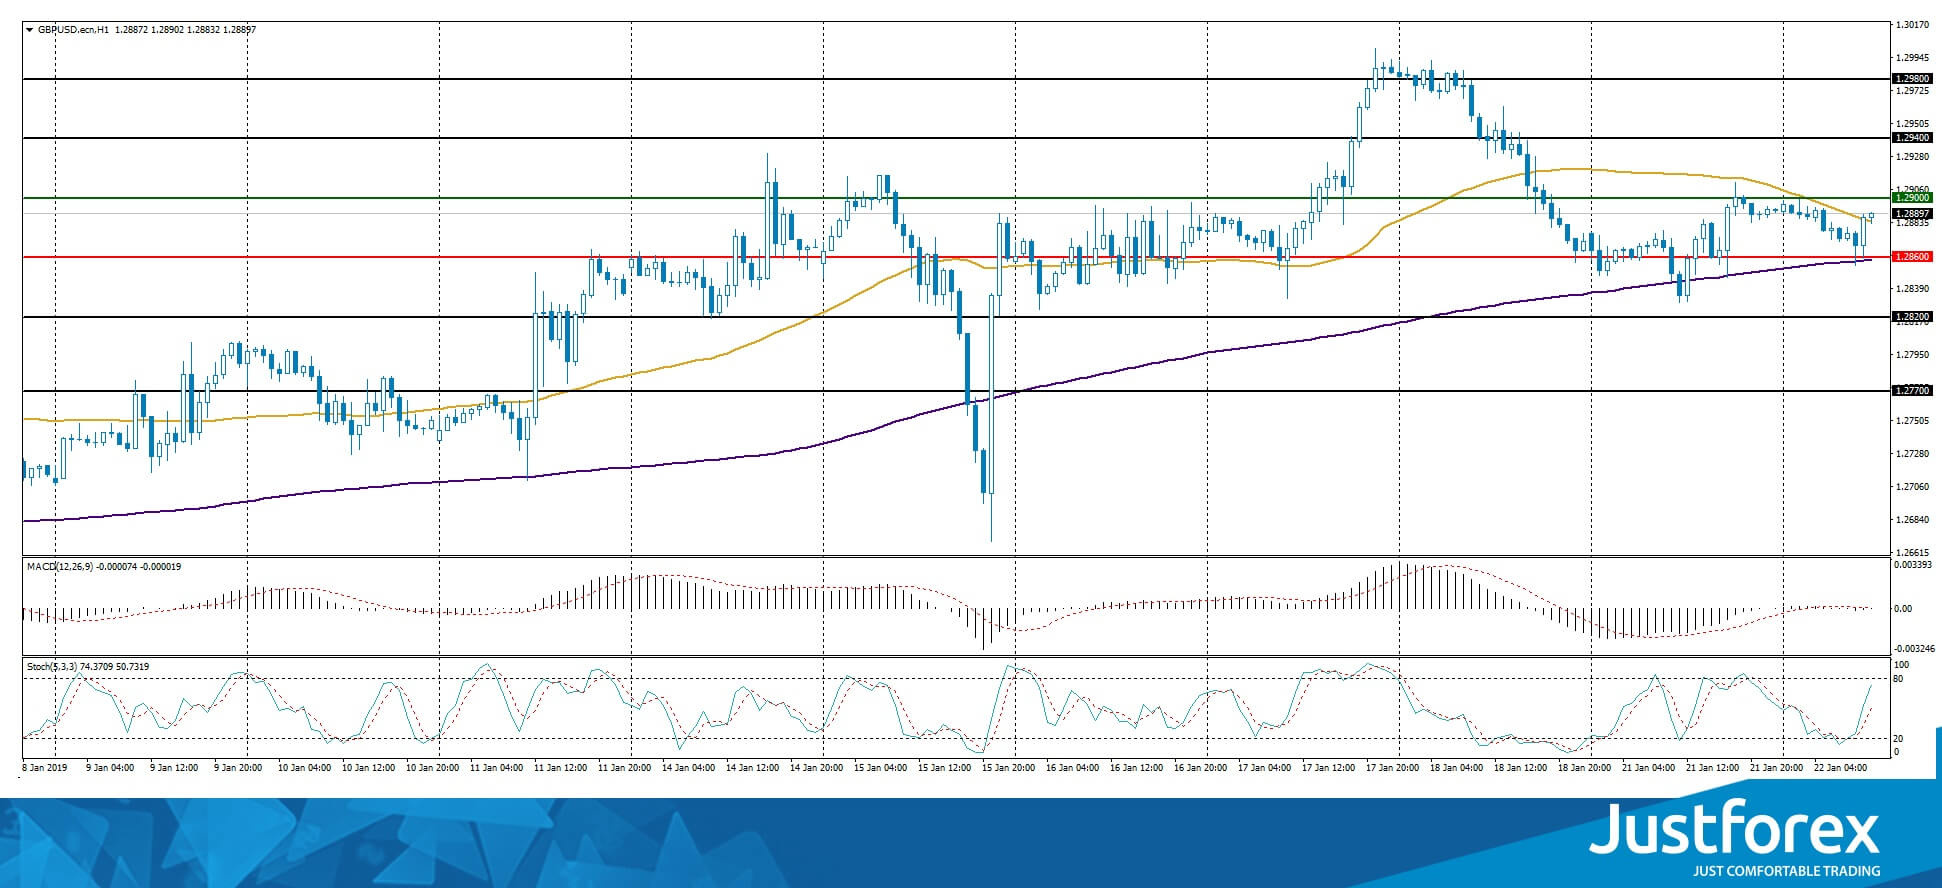
The indicators do not provide precise signals, the price is testing 50 MA.
The MACD histogram is close to 0.
The Stochastic Oscillator is in the neutral zone, the %K line is above %D line, which points to the bullish mood.
Trading recommendations
Support levels: 1.28600, 1.28200, 1.27700
Resistance levels: 1.29000, 1.29400, 1.29800
If the price fixes above 1.29000, consider opening long positions. The price will move toward 1.29400-1.29600.
Alternatively the quotes can fall toward 1.28200-1.28000.
The USD/CAD currency pair
Technical indicators of the currency pair:
Prev Open: 1.32597
Open: 1.32903
% chg. over the last day: +0.15
Day’s range: 1.33267 – 1.33356
52 wk range: 1.2248 – 1.3664
USD/CAD is in a bullish mood. Right now the key support and resistance levels are 1.33150 and 1.33400. You should open positions from these levels. The trading instrument has growth prospects. Keep an eye on the oil quotes dynamics.
The Economic News Feed for 22.01.2019 is calm.
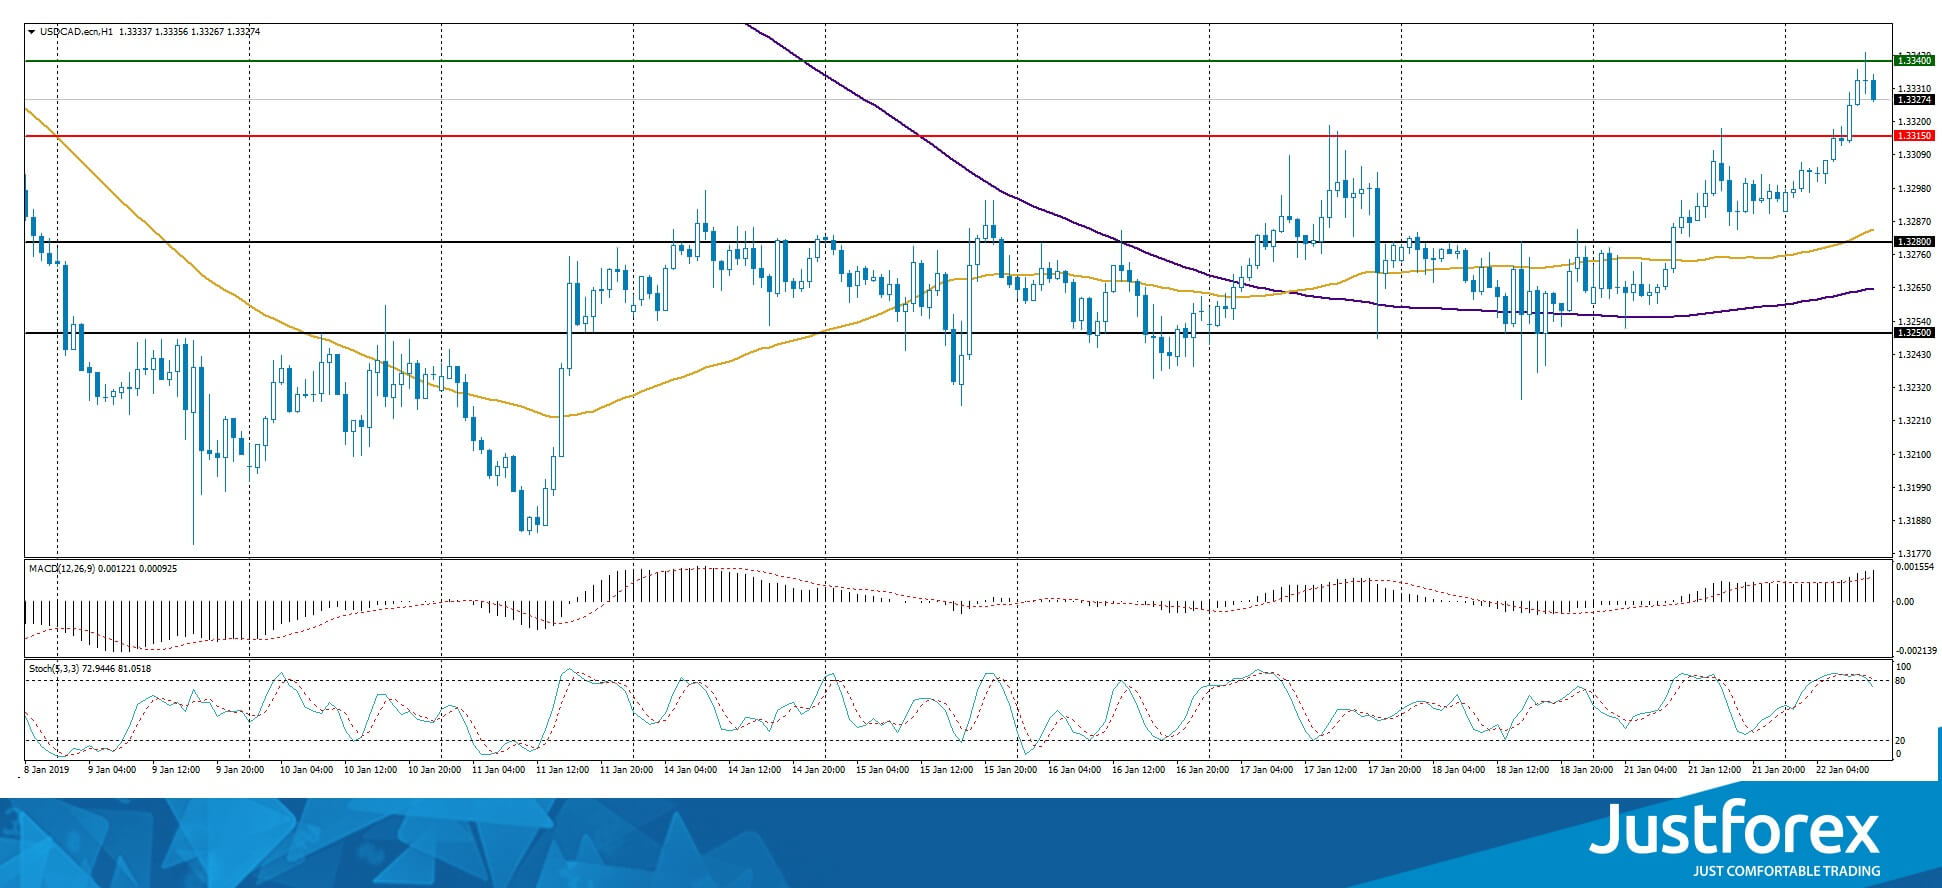
The price fixed above 50 MA and 200 MA which points to the power of the buyers.
The MACD histogram is in the positive zone and above the signal line, which gives a strong signal to buy USD/CAD.
The Stochastic Oscillator is in the overbought zone, the %K line is crossing the %D line. There are no signals at the moment.
Trading recommendations
Support levels: 1.33150, 1.32800, 1.32500
Resistance levels: 1.33400, 1.33700
If the price fixes above 1.33400, expect further growth toward 1.33700-1.34000.
Alternatively, the quotes can fall toward 1.32800-1.32500.
The USD/JPY currency pair
Technical indicators of the currency pair:
Prev Open: 109.695
Open: 109.651
% chg. over the last day: +0.00
Day’s range: 109.417 – 109.478
52 wk range: 104.56 – 114.56
USD/JPY has an ambiguous technical picture. The quotes are moving sideways. The investors are waiting for additional drivers. The key support and resistance levels are 109.300 and 109.600. You should open positions from these marks. Keep an eye on the US Treasury 10-year bonds yield.
The Economic News Feed for 22.01.2019 is calm.
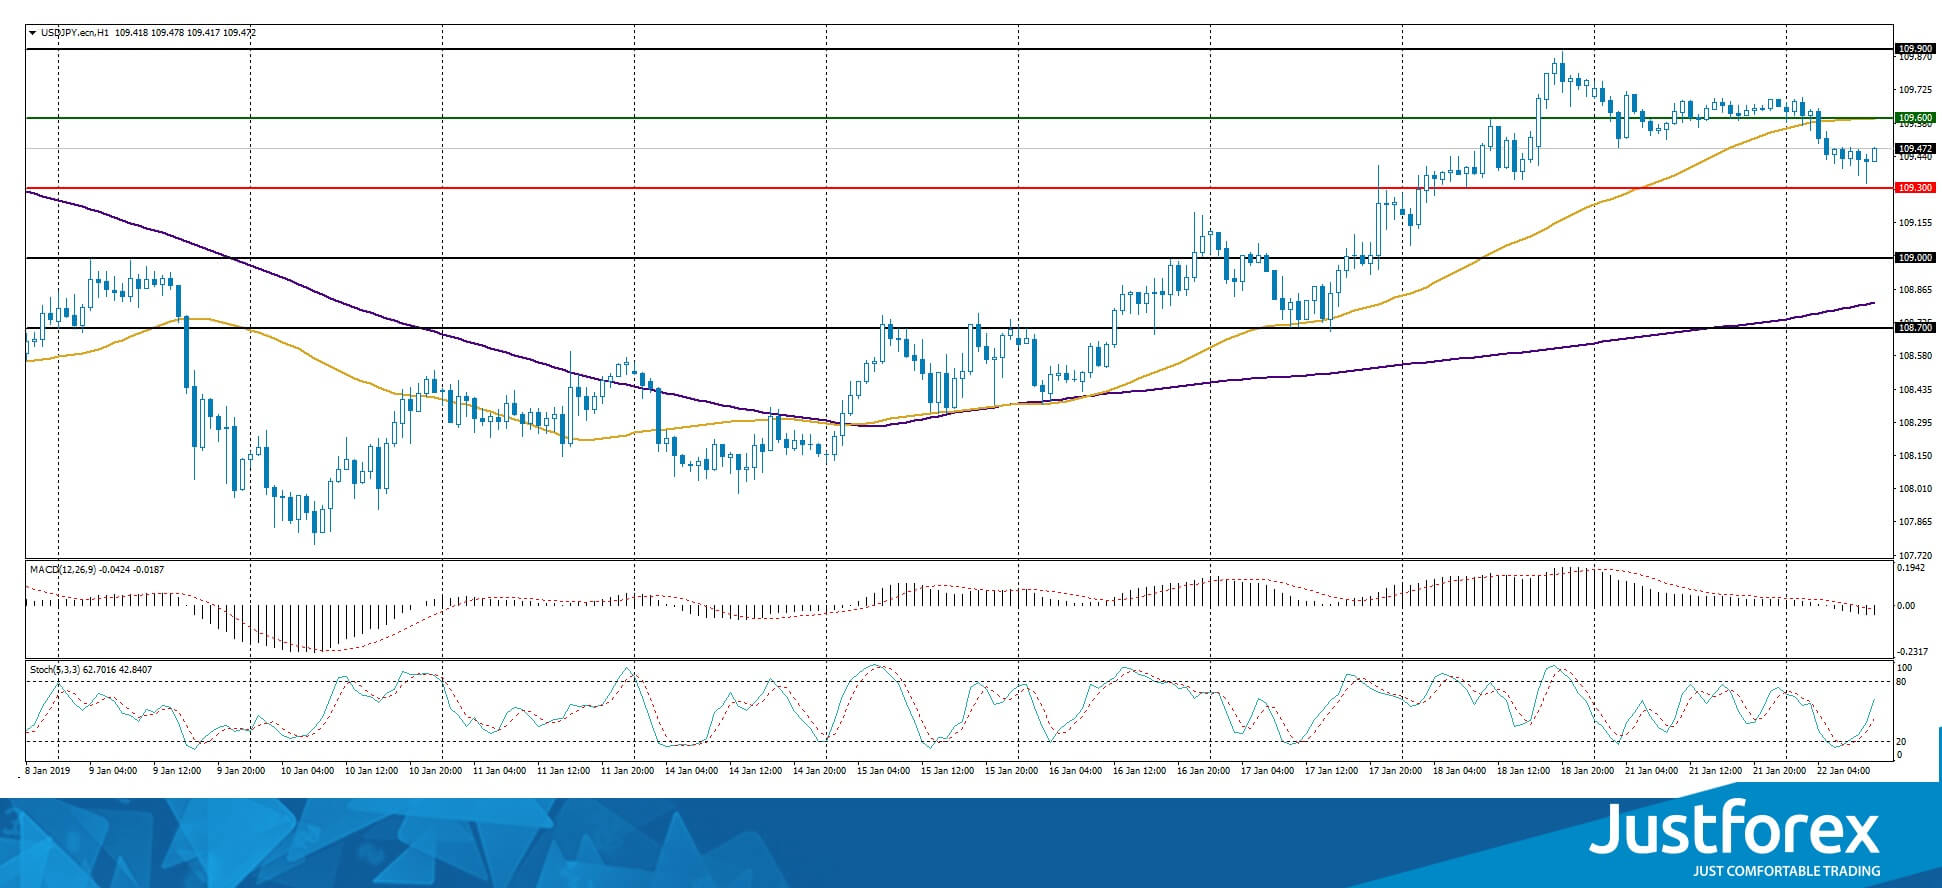
The price fixed between 50 MA and 200 MA which act as the dynamic support and resistance levels.
The MACD histogram is in the negative zone, which gives a weak signal to sell USD/JPY.
The Stochastic Oscillator is in the neutral zone, the %K line is above the %D line, which points to a bullish mood.
Trading recommendations
Support levels: 109.300, 109.000, 108.700
Resistance levels: 109.600, 109.900
If the price fixes below 109.300, expect the USD/JPY quotes to fall toward 109.000.
Alternatively, the quotes can grow toward 109.900-110.100.


