
The EUR/USD currency pair
Technical indicators of the currency pair:
Prev Open: 1.13249
Open: 1.12602
% chg. over the last day: -0.53
Day’s range: 1.12490 – 1.12948
52 wk range: 1.1214 – 1.2557
The EUR started to descend. Yesterday the quotes fell by 70 points. The trading instrument updated the new monthly minimums. The pressure on EUR is cause by the weak economic reports, the loss of profitability of the Germany government bonds and a high demand for USD. Right now the currency pair is testing the 1.12500 support. 1.12850 acts as the resistance. Keep an eye on the US/China negotiations and open positions from the key levels.
The Economic News Feed for 14.02.2019:
GDP report (EU) – 12:00 (GMT+2:00);
Retail Sales report (US) – 15:30 (GMT+2:00);
Manufacturer’s Price Index (US) – 15:30 (GMT+2:00);
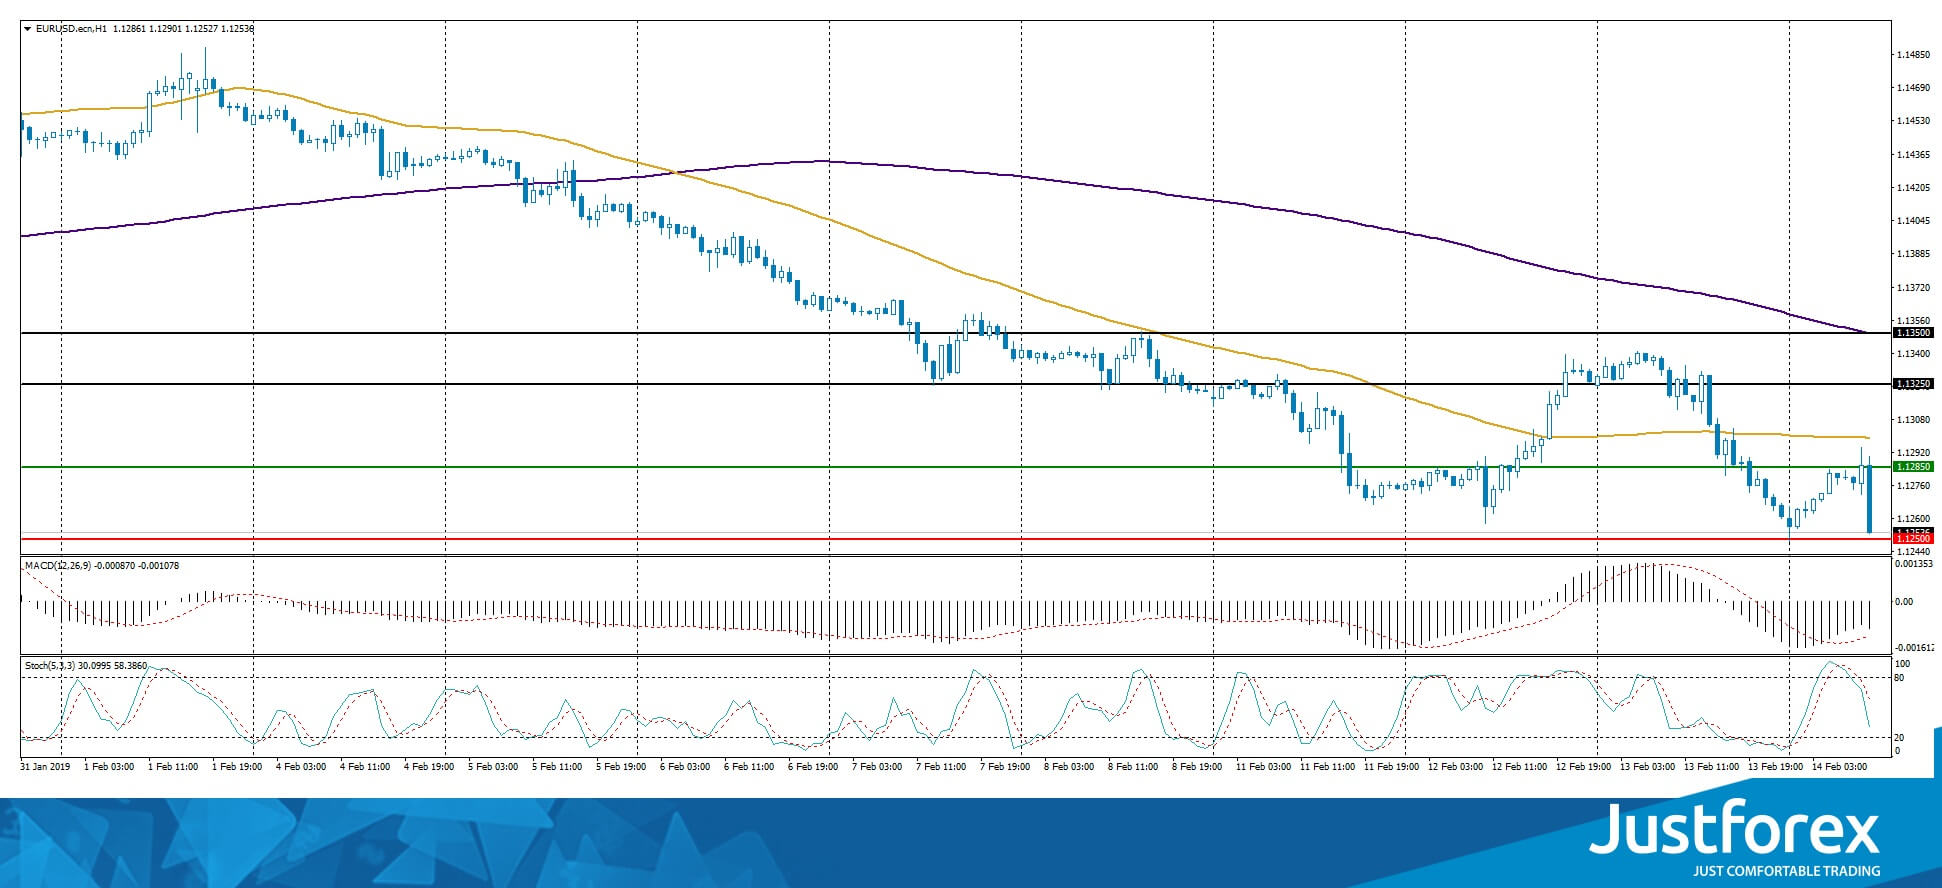
The indicators point to the power of the sellers, the price fixed below 50 MA and 200 MA.
The MACD histogram is in the negative zone and keeps falling, which points to the further descend of the EUR/USD quotes.
The Stochastic Oscillator is in the neutral zone, the %K line is below the %D line, which also suggests that you should sell EUR/USD.
Trading recommendations
Support levels: 1.12500, 1.12000
Resistance levels: 1.12850, 1.13250, 1.13500
If the price fixes below 1.12500, expect the quotes to fall toward 1.12000.
Alternatively, the quotes can rise toward 1.13200-1.13400.
The GBP/USD currency pair
Technical indicators of the currency pair:
Prev Open: 1.28910
Open: 1.28444
% chg. over the last day: -0.29
Day’s range: 1.28132 – 1.28775
52 wk range: 1.2438 – 1.4378
The GBP/USD quotes keep showing a negative trend. Right now the trading instrument is testing the monthly minimums. The pressure on the pound is caused by the weak inflation report in the UK. The Brexit ambiguousness remains in the spotlight. The quotes have a tendency to descend further. The local support and resistance levels are 1.28200 and 1.28500. Open your positions from these marks.
The Economic News Feed for 14.02.2019 is calm.
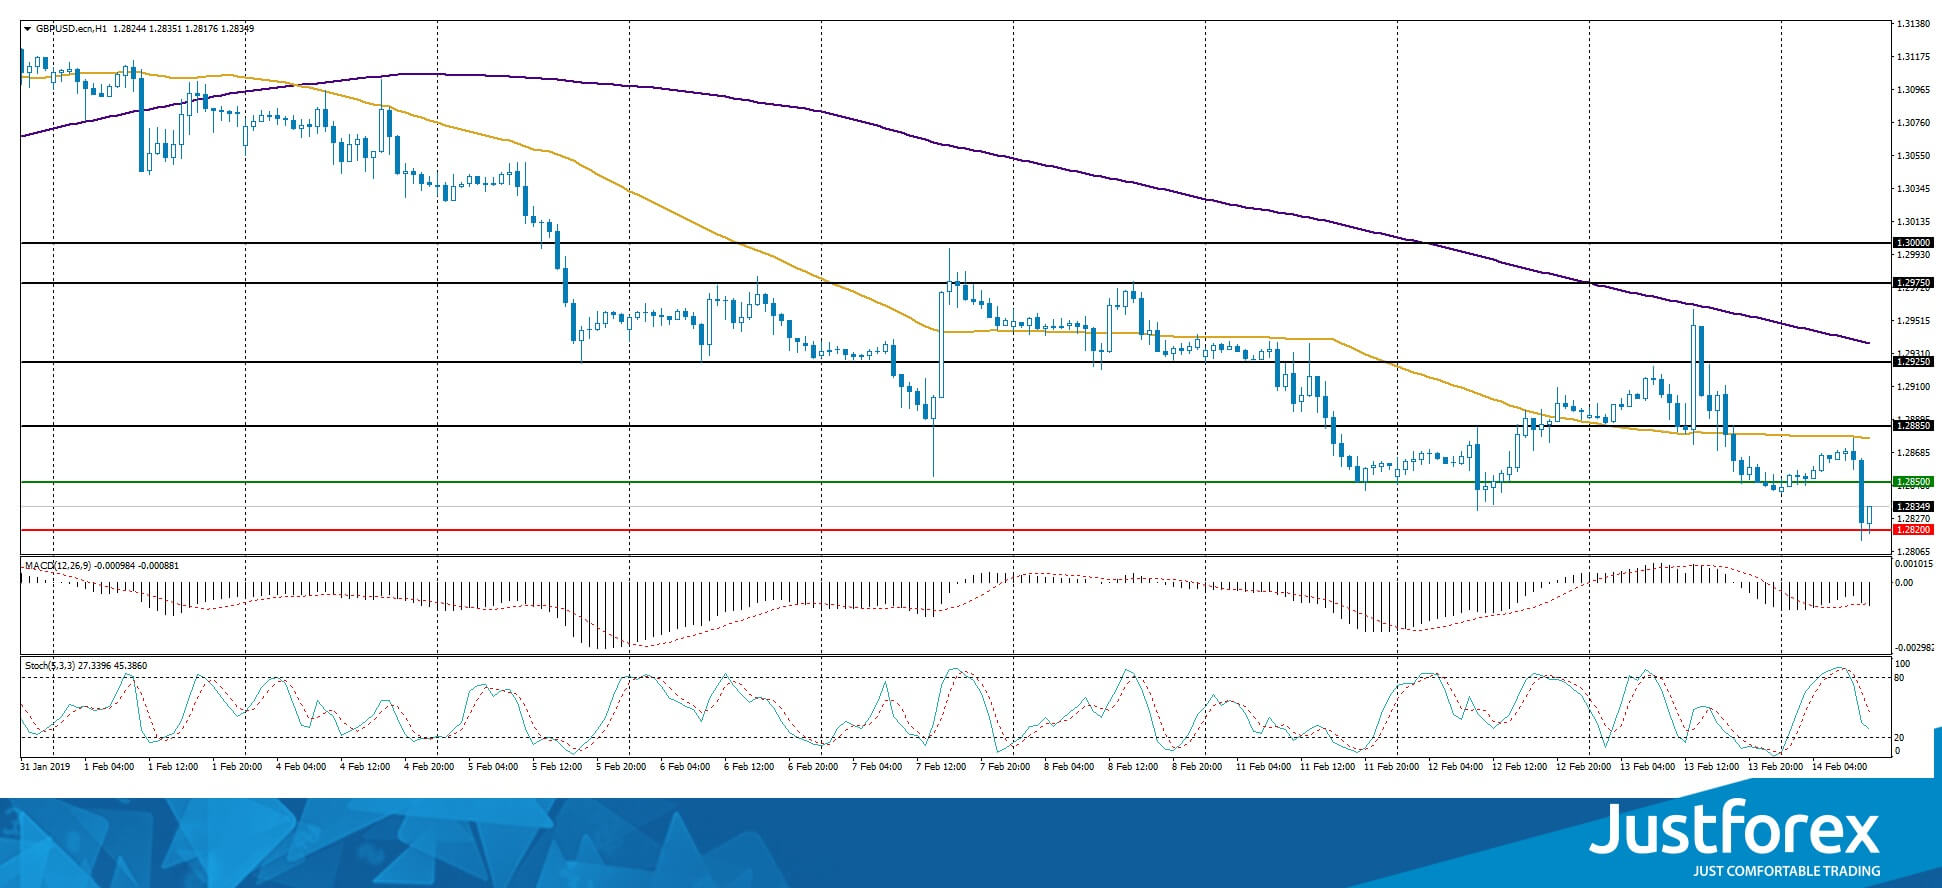
The indicators point to the power of the buyers, the price fixed below 50 MA and 200 MA.
The MACD histogram is in the negative zone and below the signal line which gives a strong signal to sell GBP/USD.
The Stochastic Oscillator is in the neutral zone, the %K line is below the %D line which also points to a bearish mood.
Trading recommendations
Support levels: 1.28200, 1.28000
Resistance levels: 1.28500, 1.28850, 1.29250
If the price fixes below 1.28200, expect the quotes to fall toward 1.27800-1.27500.
Alternatively, the quotes can correct toward 1.28850-1.29000.
The USD/CAD currency pair
Technical indicators of the currency pair:
Prev Open: 1.32360
Open: 1.32520
% chg. over the last day: +0.18
Day’s range: 1.32288 – 1.32680
52 wk range: 1.2248 – 1.3664
USD/CAD is showing an ambiguous technical picture. Right now CAD is consolidating. The local support and resistance levels are 1.32300 and 1.32650. The trading instrument has prospects for future correction. CAD is supported by th epositive oil quotes dynamics. You should open positions from the key levels.
The Economic News Feed for 14.02.2019 is calm.
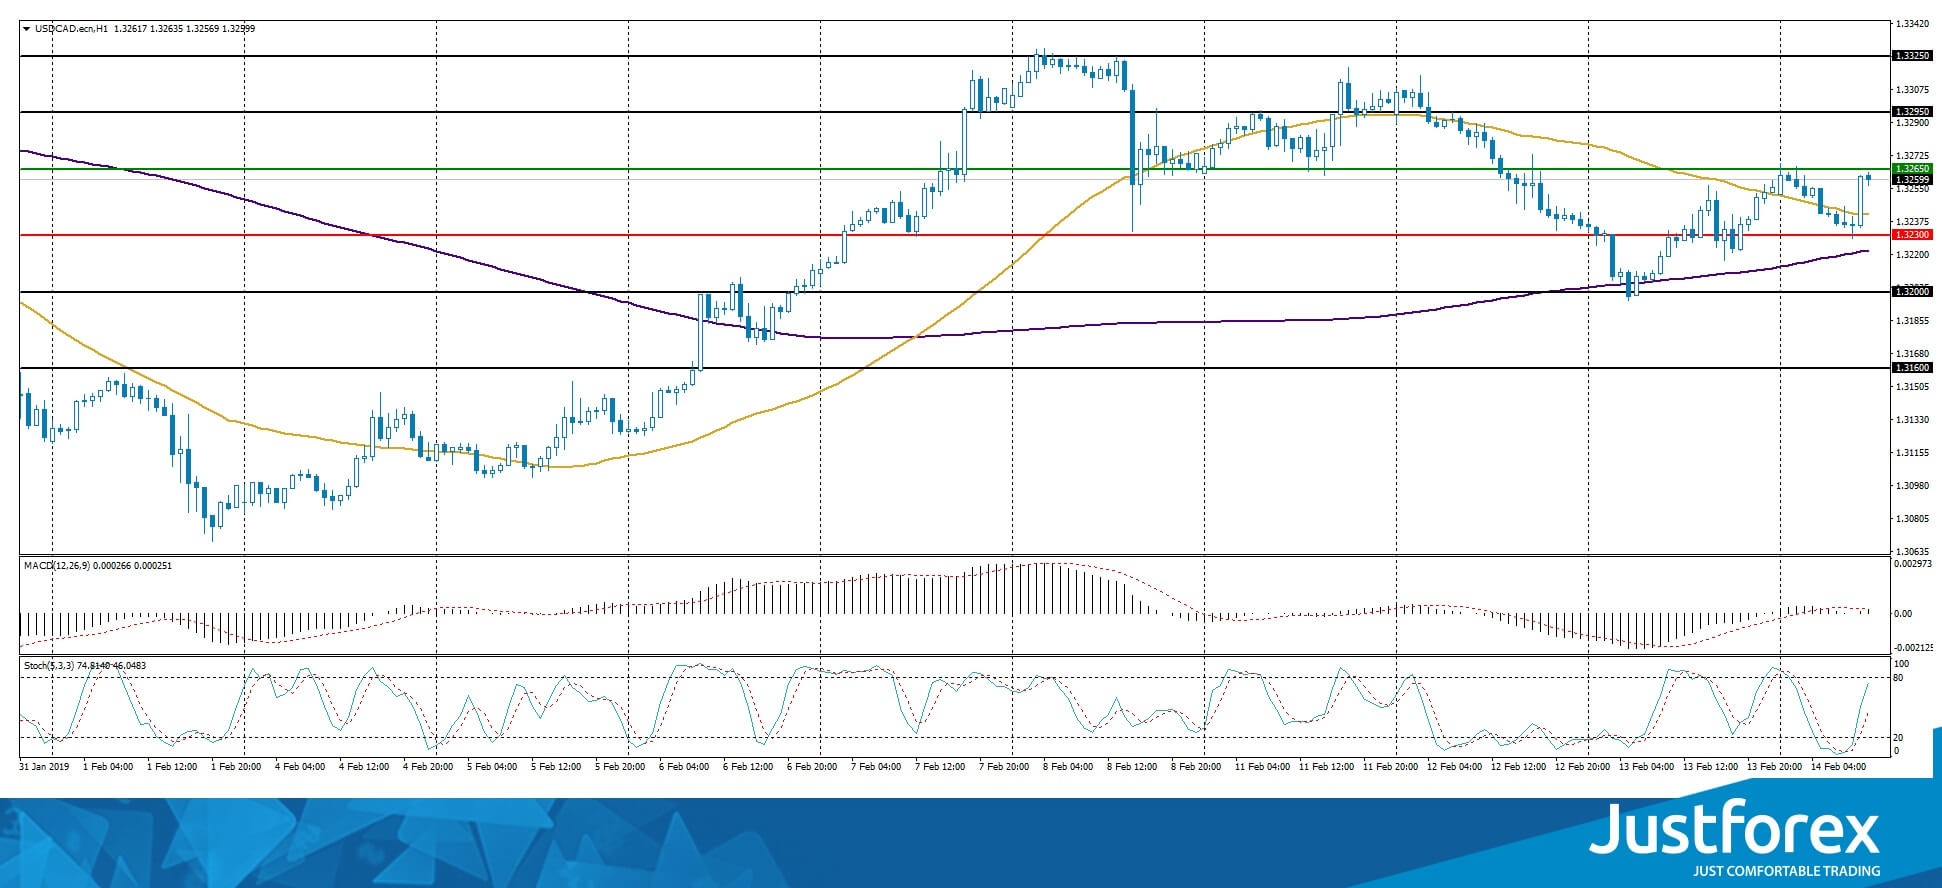
The indicators do not provide precise signals, the price crossed 50 MA.
The MACD histogram is close to 0.
The Stochastic Oscillator is in the neutral zone, the %K line is above the %D line which points to a bullish mood.
Trading recommendations
Support levels: 1.32300, 1.32000, 1.31600
Resistance levels: 1.32650, 1.32950, 1.33250
If the price fixes below 1.32300 expect the quotes to correct toward 1.320001.31700.
Alternatively, the quotes can grow toward 1.33000-1.33250.
The USD/JPY currency pair
Technical indicators of the currency pair:
Prev Open: 110.458
Open: 110.972
% chg. over the last day: +0.41
Day’s range: 110.865 – 111.126
52 wk range: 104.56 – 114.56
The safe haven currency keeps losing postions against the USD. During the last two days, the quotes grew by 60 points. The trading instrument found the resistance around 111.000. The closest support is 110.850. USD/JPY has prospect for further growth. Keep an eye on US economic reports. You should open positions from the key levels.
Today Japan published a weak GDP report.
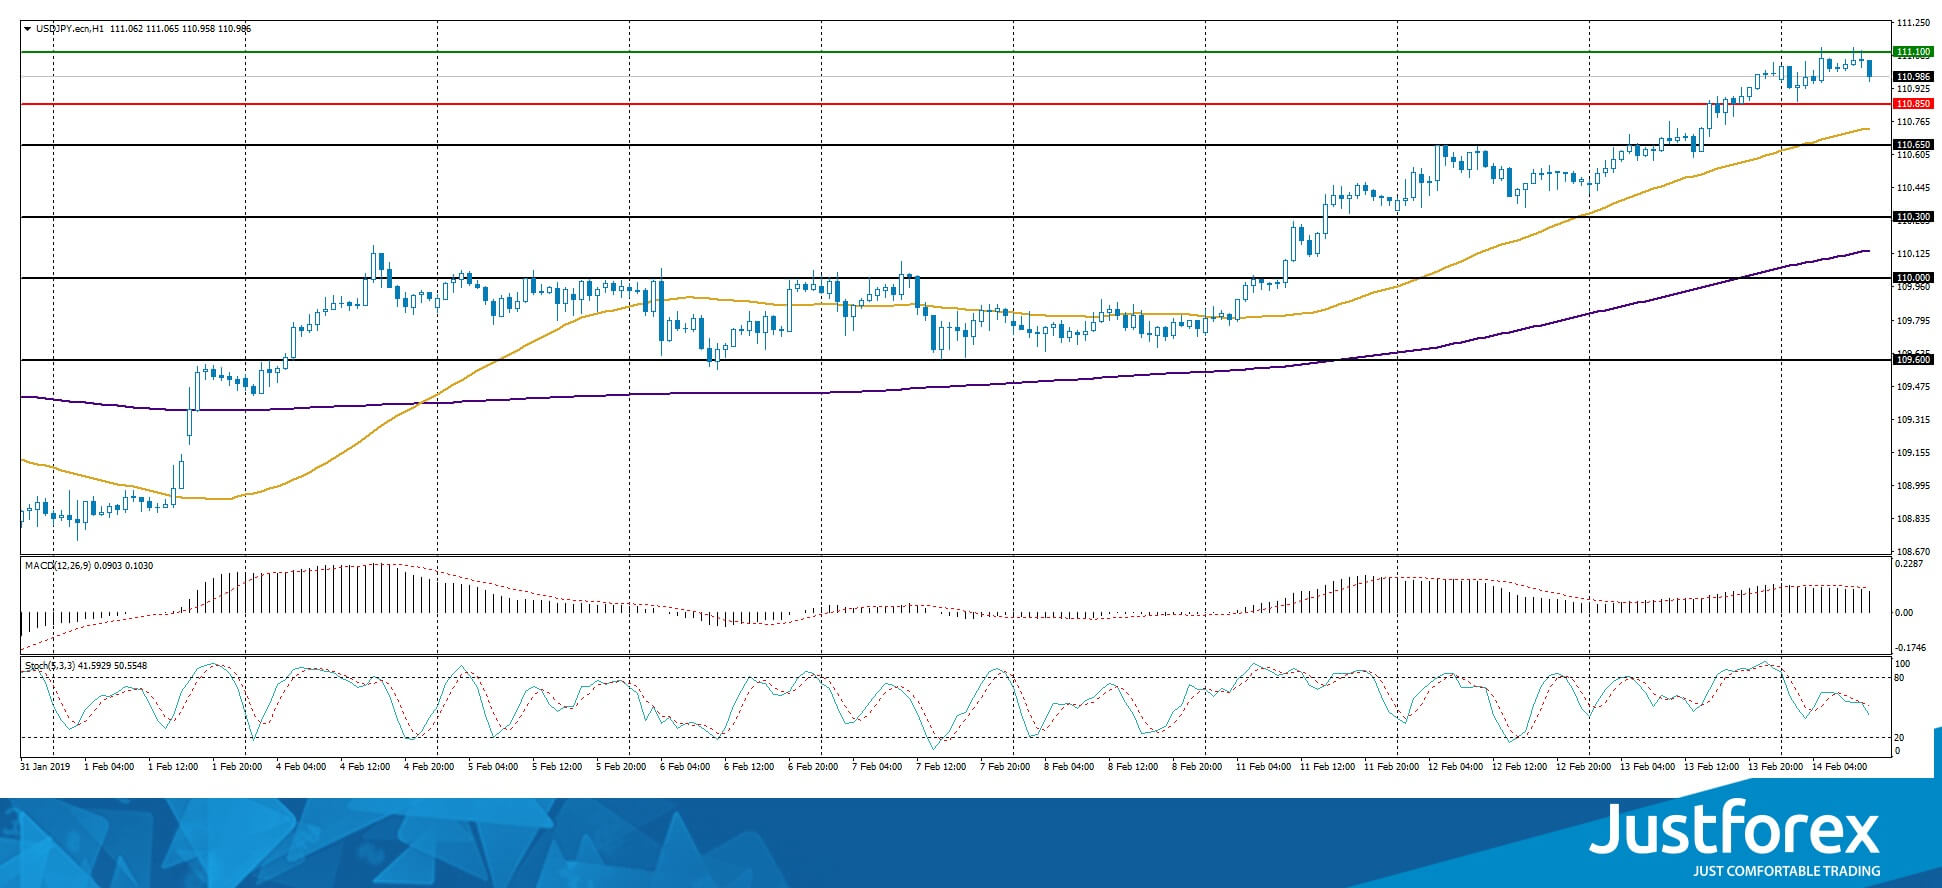
The price fixed above 50 MA and 200 MA which points to the power of the buyers.
The MACD histogram is in the positive zone but below the signal line which gives a weak signal to buy USD/JPY.
The Stochastic Oscillator is in the neutral zone, the %K line is below the %D line which points to a bearish mood.
Trading recommendations
Support levels: 110.850, 110.650, 110.300
Resistance levels: 111.100, 111.500
If the price fixes above 111.100 expect the quotes to grow toward 111.500.
Alternatively, the quotes can fall toward 110.600-110.400.


