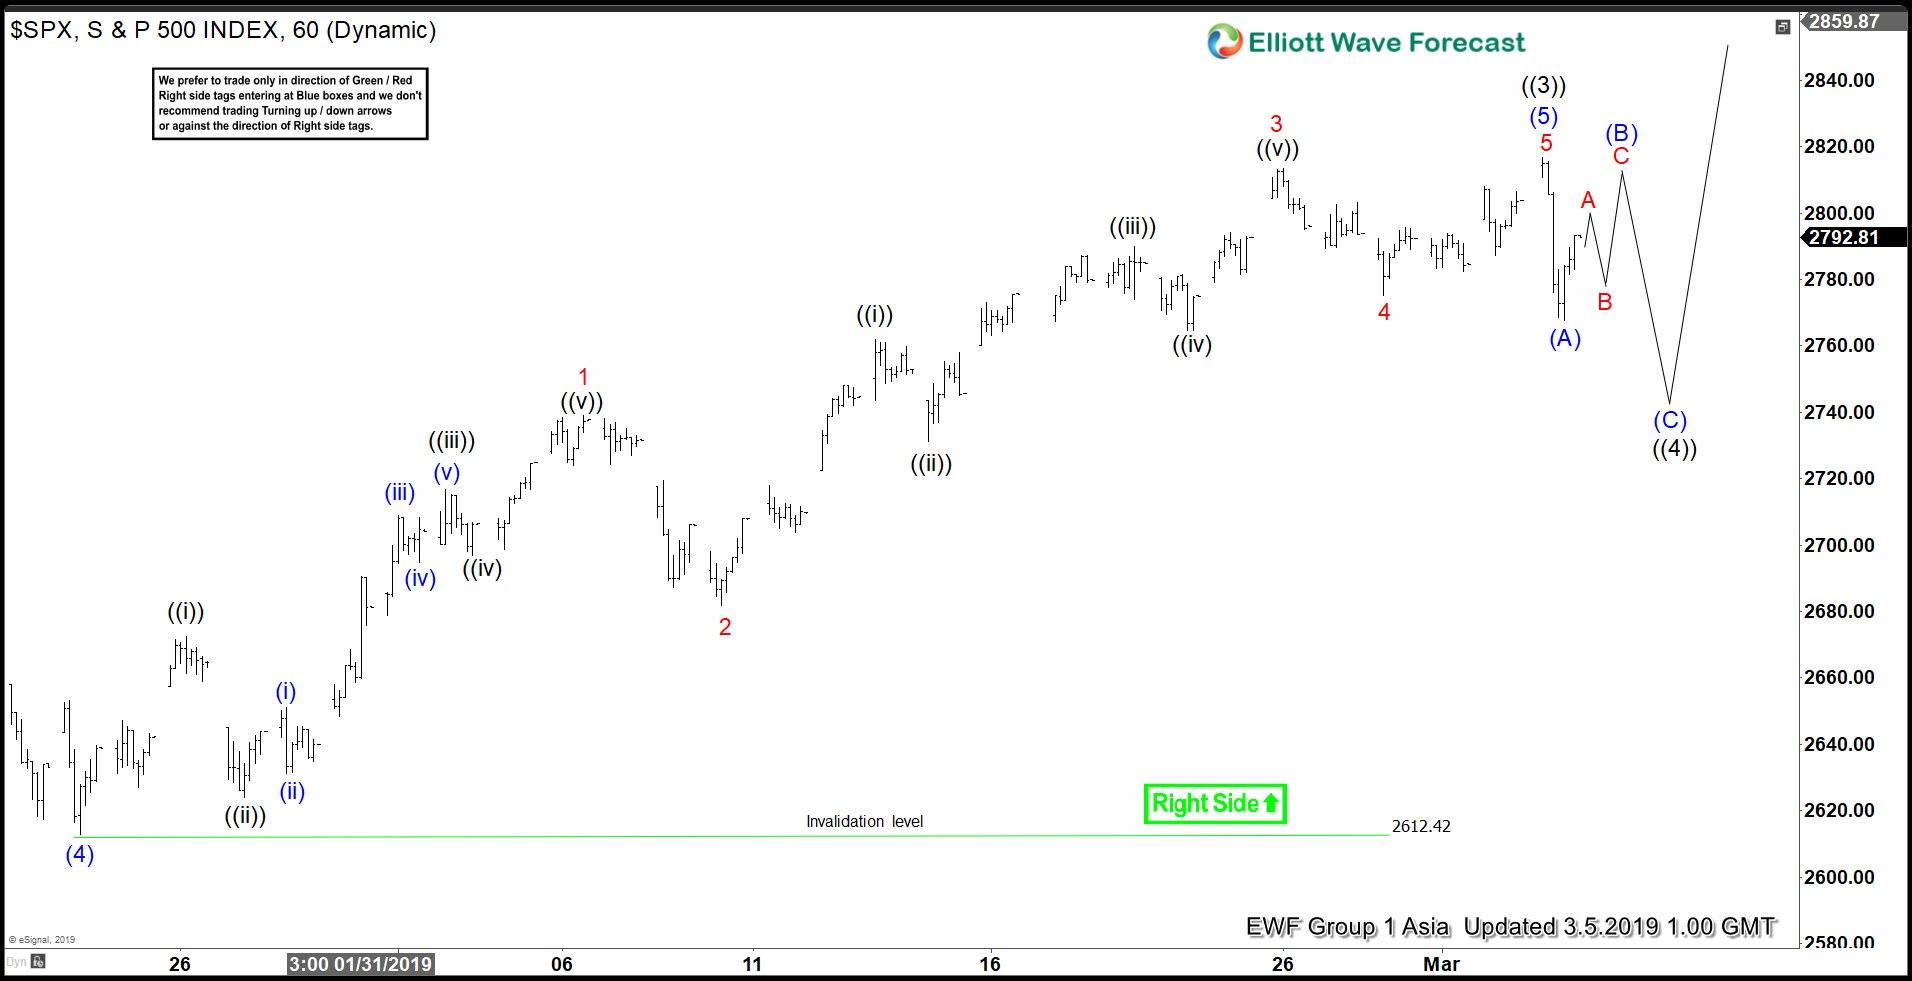
SPX pulled back in 3 waves last week and put in a strong rally which has already resulted in new highs. In this blog, we are going to take a look at structure of this 3 wave pull back and the subsequent reaction from the blue box. We share one chart from members area every day in the form of Chart of the day, we picked SPX as Chart of the day on 3.5.2019 which showed Index made a sharp decline on 3.4.2019 which we labelled as wave (A) and stared bouncing.
SPX 1 Hour chart from 3.5.2019 Chart Of The Day
As the chart below shows, we expected a bounce in wave (B) to fail below 2816.88 wave ((3)) high followed by another decline in the form of wave (C) to complete wave ((4)) pull back and then rally to resume.
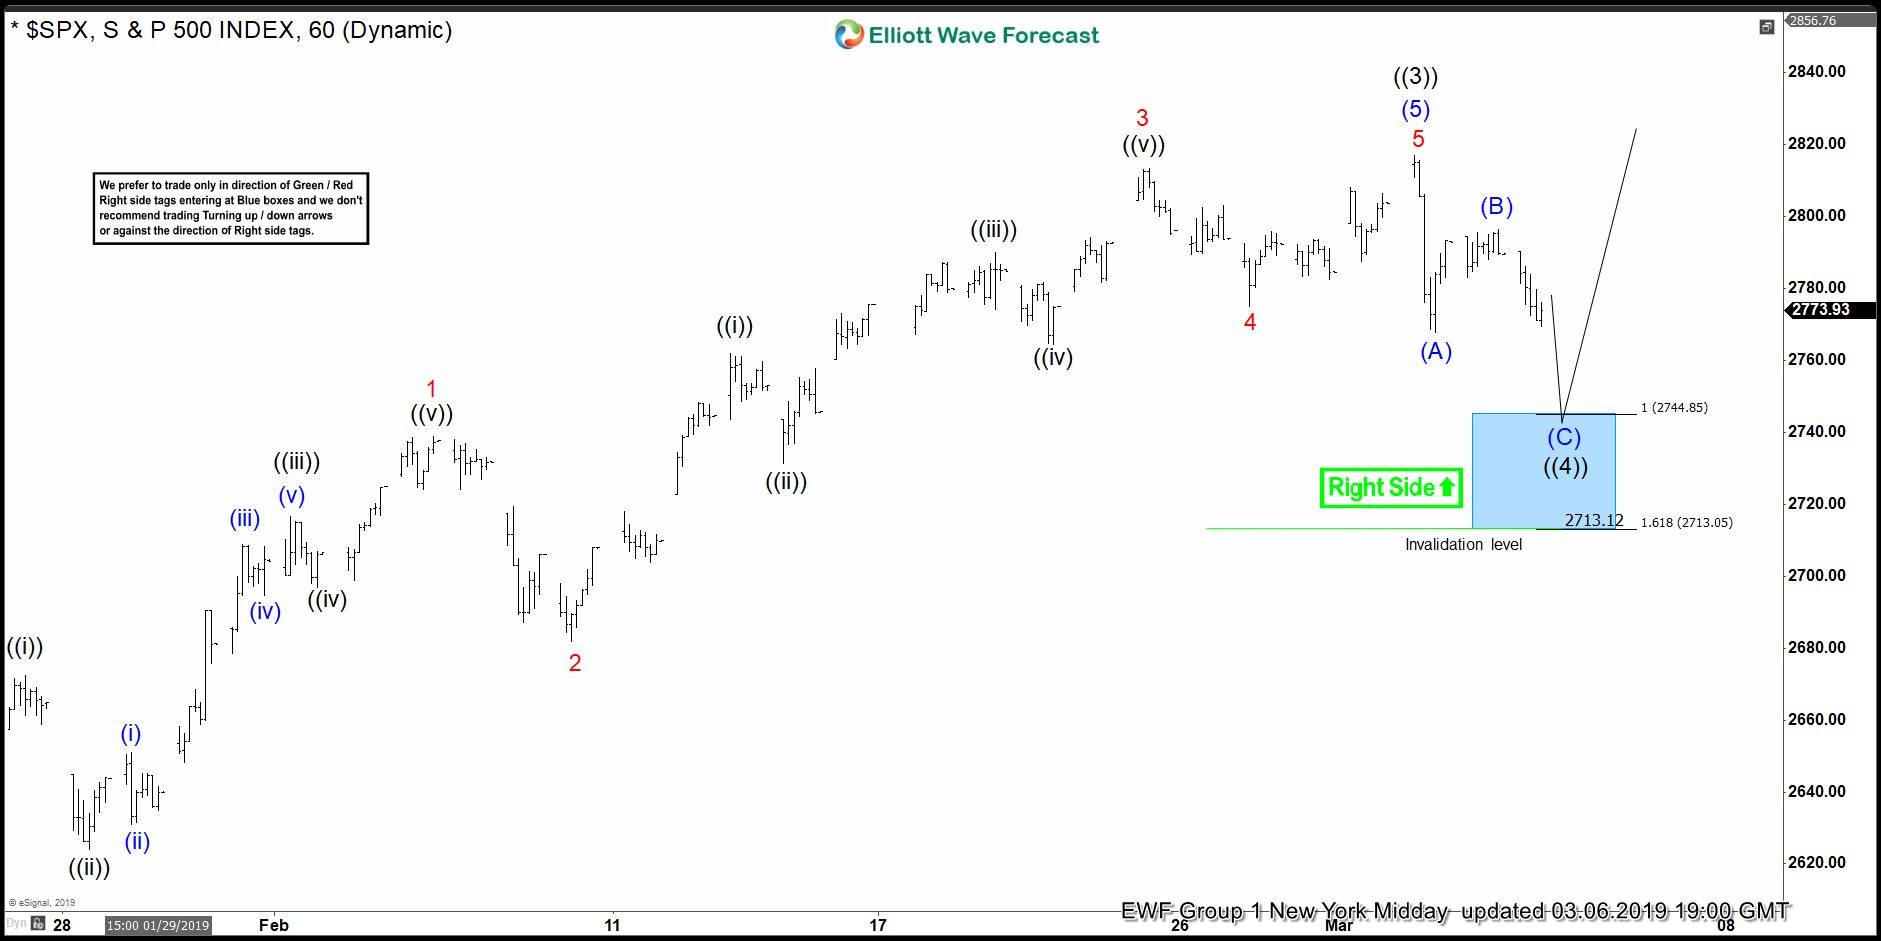
SPX 1 Hour Elliott Wave Chart 3.6.2019
Chart below shows Index completed wave (B) bounce as expected and started turning lower. As wave (B) is now well defined so we presented a blue box on the chart to highlight the area for Elliott wave zig-zag structure to end and wave ((4)) to complete between 2744.85 – 2713.05. Blue boxes on our charts are high frequency areas and are expected to produce 3 waves reaction at least, we call them no enemy areas as both buyers and sellers agree in blue box in the direction of the next move for 3 waves at least.
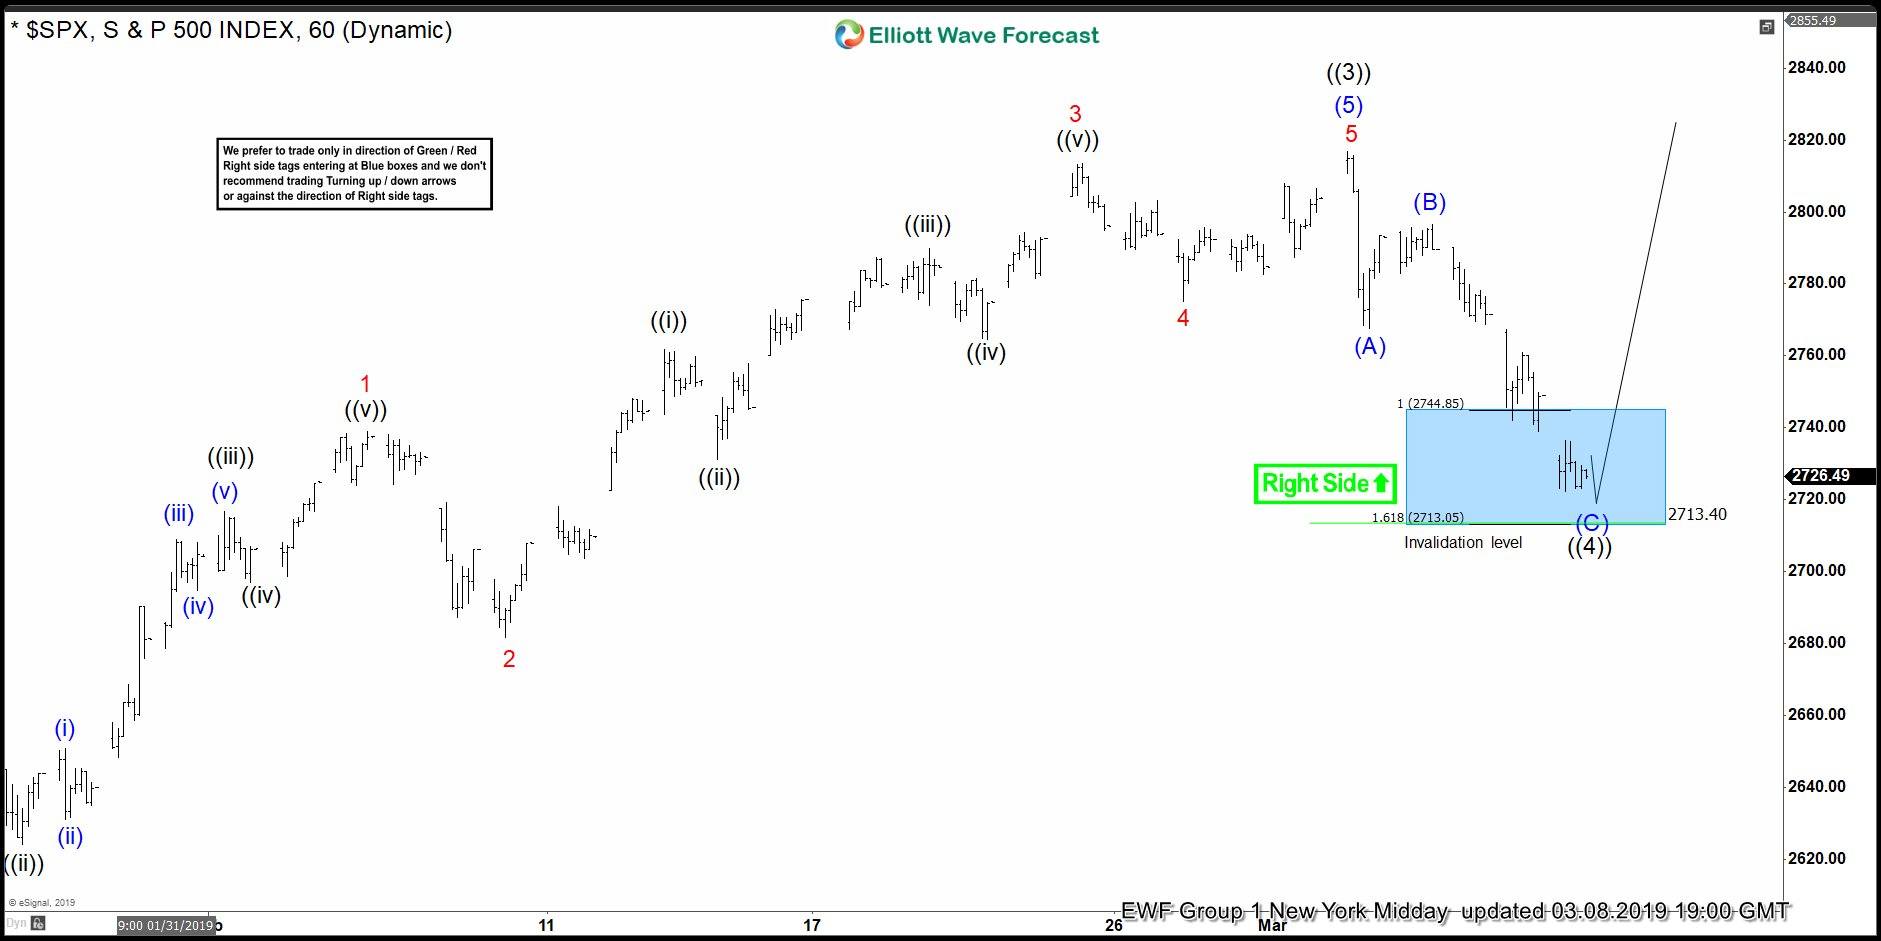
SPX 1 Hour Elliott Wave Chart 3.8.2019
Chart below shows Index traded lower as expected and reached blue box area between 2744.85 – 2713.05 on 3.8.2019, we were expecting wave (C) to end and Index to turn up and either resume the rally for a new high above wave ((3)) or bounce in 3 waves at least as per Elliott wave hedging concept to allow buyers to create a risk free position on the trade.
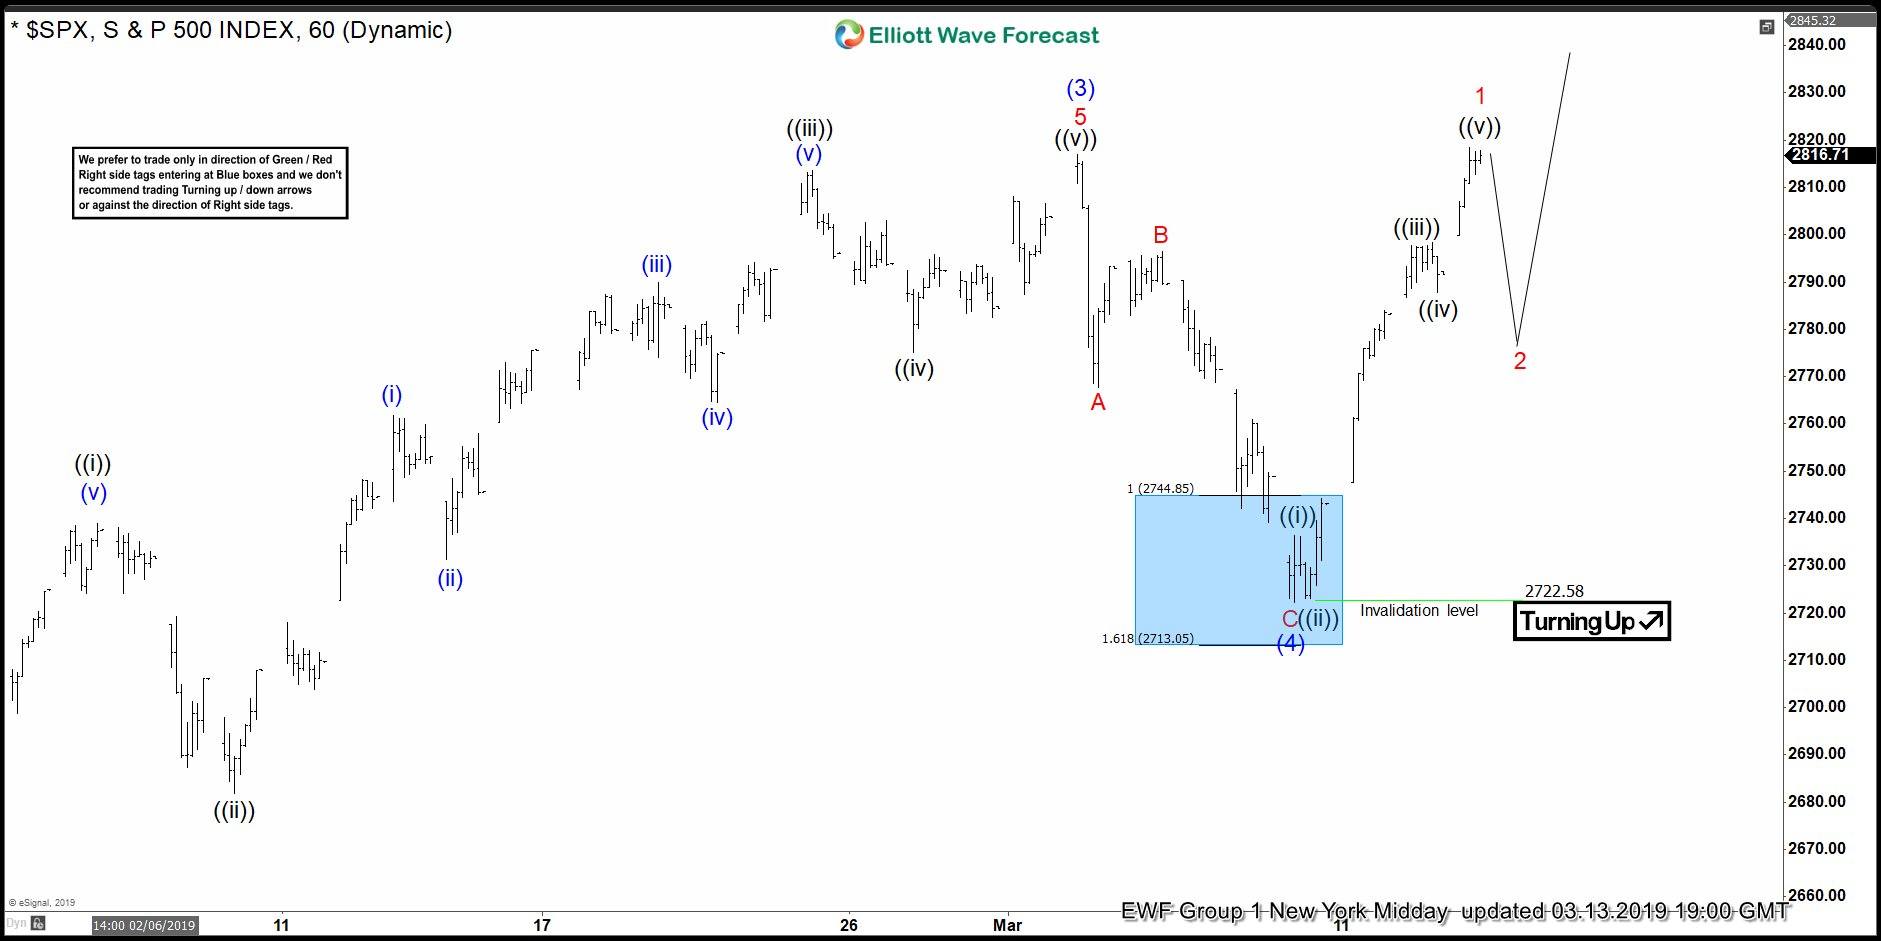
SPX 1 Hour Elliott Wave Chart 3.13.2019
Index rallied from the blue box and has already broken above 3.4.2019 peak. Here is the latest 1 Hour chart from 3.13.2019 Mid-day New York update which shows the reaction higher from the blue box.