
Key Highlights
- The US Dollar found a strong resistance above 112.00 and recently declined against the Japanese Yen.
- Two important bearish trend lines are in place near 111.60 and 112.50 on the daily chart of USD/JPY.
- The US Initial Jobless Claims for the week ending March 16, 2019 declined from 230K to 221K.
- The US Manufacturing PMI for March 2019 (Preliminary) could rise from 53.0 to 53.6.
USDJPY Technical Analysis
In January and February 2019, the US Dollar followed a solid bullish path above 108.00 against the Japanese Yen. The USD/JPY pair traded above 110.00, but it found a strong resistance above 112.00 and later started a downside correction.
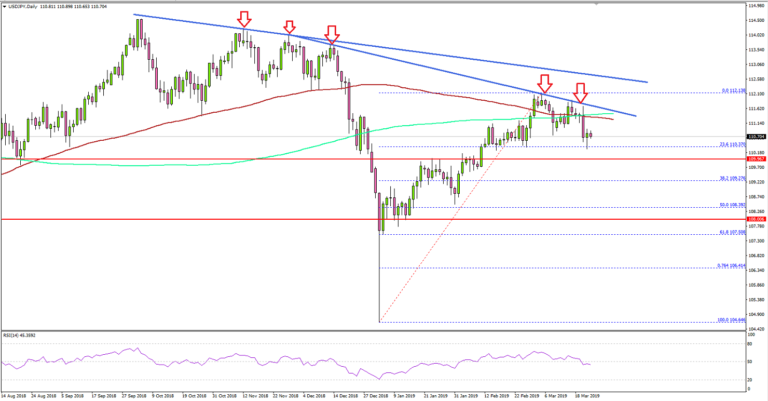
Looking at the daily chart, the pair traded as high as 112.13 and later corrected lower. The pair failed to hold gains above 111.60, the 200-day simple moving average (green), and 100-day simple moving average (red).
The pair tested the 23.6% Fib retracement level of the last wave from the 104.64 low to 112.13 high. An immediate support is near the 110.00 level, below which the pair could extend the downside correction.
The next key support is at 108.20-108.40, which also coincides with the 50% Fib retracement level of the last wave from the 104.64 low to 112.13 high. On the upside, there are two important bearish trend lines in place near 111.60 and 112.50 on the daily chart.
To remain in an uptrend, the pair must break both trend lines and settled above the 112.50 resistance level. If not, there is a risk of a downside correction towards the 110.00 or 108.20 support.
Fundamentally, the US Initial Jobless Claims figure for the week ending March 16, 2019 was released recently by the US Department of Labor. The market was looking for a decline in claims from 229K to 225K.
However, the actual result was better as the US Initial Jobless Claims declined to 221K. However, the last reading was revised up from 229K to 230K.
The report added:
The 4-week moving average was 225,000, an increase of 1,000 from the previous week’s revised average. The previous week’s average was revised up by 250 from 223,750 to 224,000.
Overall, the USD/JPY pair is facing a solid resistance near 112.00 on the daily chart, which may spark a solid decline in the near term.
Economic Releases to Watch Today
- Germany’s Manufacturing PMI for March 2019 (Preliminary) – Forecast 48.0, versus 47.6 previous.
- Germany’s Services PMI for March 2019 (Preliminary) – Forecast 54.8, versus 55.3 previous.
- Euro Zone Manufacturing PMI March 2019 (Preliminary) – Forecast 49.5, versus 49.3 previous.
- Euro Zone Services PMI for March 2019 (Preliminary) – Forecast 52.7, versus 52.8 previous.
- US Manufacturing PMI for March 2019 (Preliminary) – Forecast 53.6, versus 53.0 previous.
- US Services PMI for March 2019 (Preliminary) – Forecast 56.0, versus 56.0 previous.
- Canadian Consumer Price Index Feb 2019 (MoM) – Forecast +0.6%, versus +0.1% previous.
- Canadian Consumer Price Index Feb 2019 (YoY) – Forecast +1.4%, versus +1.4% previous.


