
The EUR/USD currency pair
Technical indicators of the currency pair:
Prev Open: 1.12274
Open: 1.12120
% chg. over the last day: -0.16
Day’s range: 1.11919 – 1.12122
52 wk range: 1.1214 – 1.2557
EUR/USD remains in a bearish mood. Right now the trading instrument is consolidating around 1.12000. The pressure on the EUR is caused by the weak economic releases.
The Economic News Feed for 02.04.2019:
Primary Orders on Durable Goods (US) – 15:30 (GMT+2:00);
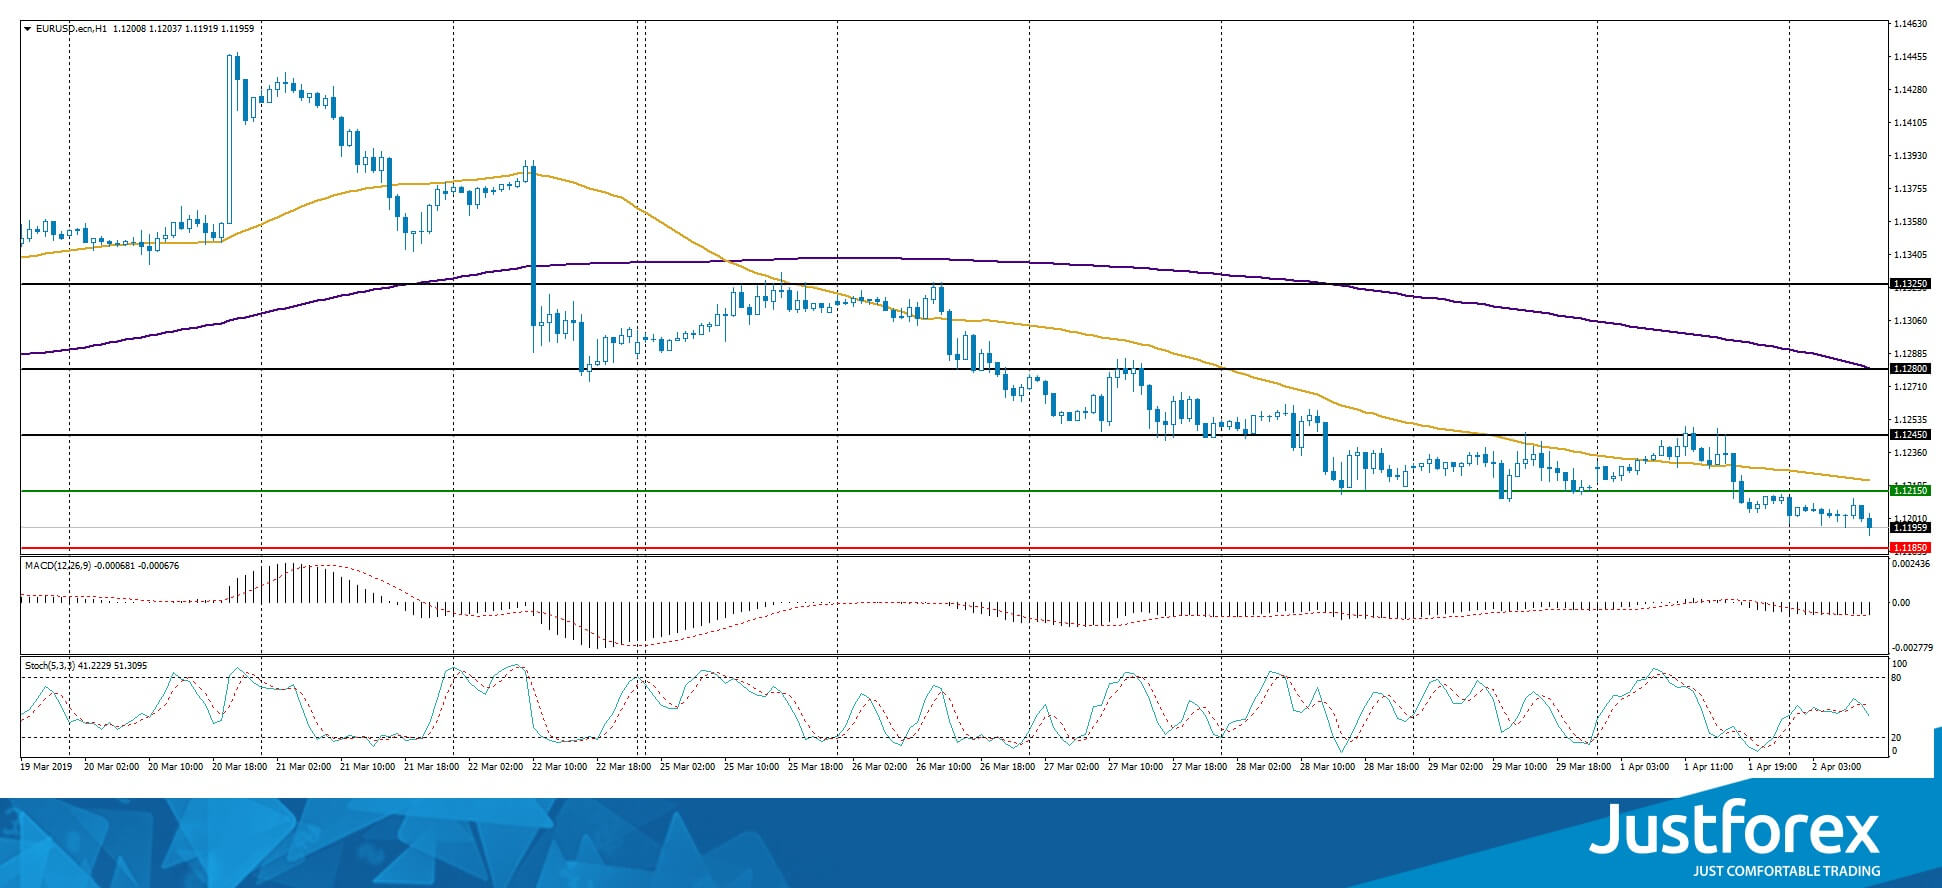
The indicators point to the power of the buyers, the price fixed below 50 MA and 200 MA.
The MACD histogram is in the negative zone and keeps falling which gives a signal to sell EUR/USD.
The Stochastic Oscillator is in the neutral zone, the %K line is crossing the %D line. There are no signals at the moment.
Trading recommendations
Support levels: 1.11850, 1.11500
Resistance levels: 1.12150, 1.12450, 1.12800
If the price fixed below 1.11850, expect the quotes to fall toward 1.1500-1.11300.
Alternatively, the quotes can correct toward 1.12450-1.12600.
The GBP/USD currency pair
Technical indicators of the currency pair:
Prev Open: 1.30395
Open: 1.30925
% chg. over the last day: +0.35
Day’s range: 1.30238 – 1.31141
52 wk range: 1.2438 – 1.4378
GBP/USD remains active. The financial market participants are evaluating the Brexit situation – so far the British parliament refused to approve 4 alternative Brexit strategies. The EU representatives consider “hard Brexit” the most plausible option. The GBP/USD quotes are testing the 1.30300 and 1.30800 support and resistance levels. You should open positions from them.
At 11:30 (GMT+3:00) the UK will publish a construction PMI.
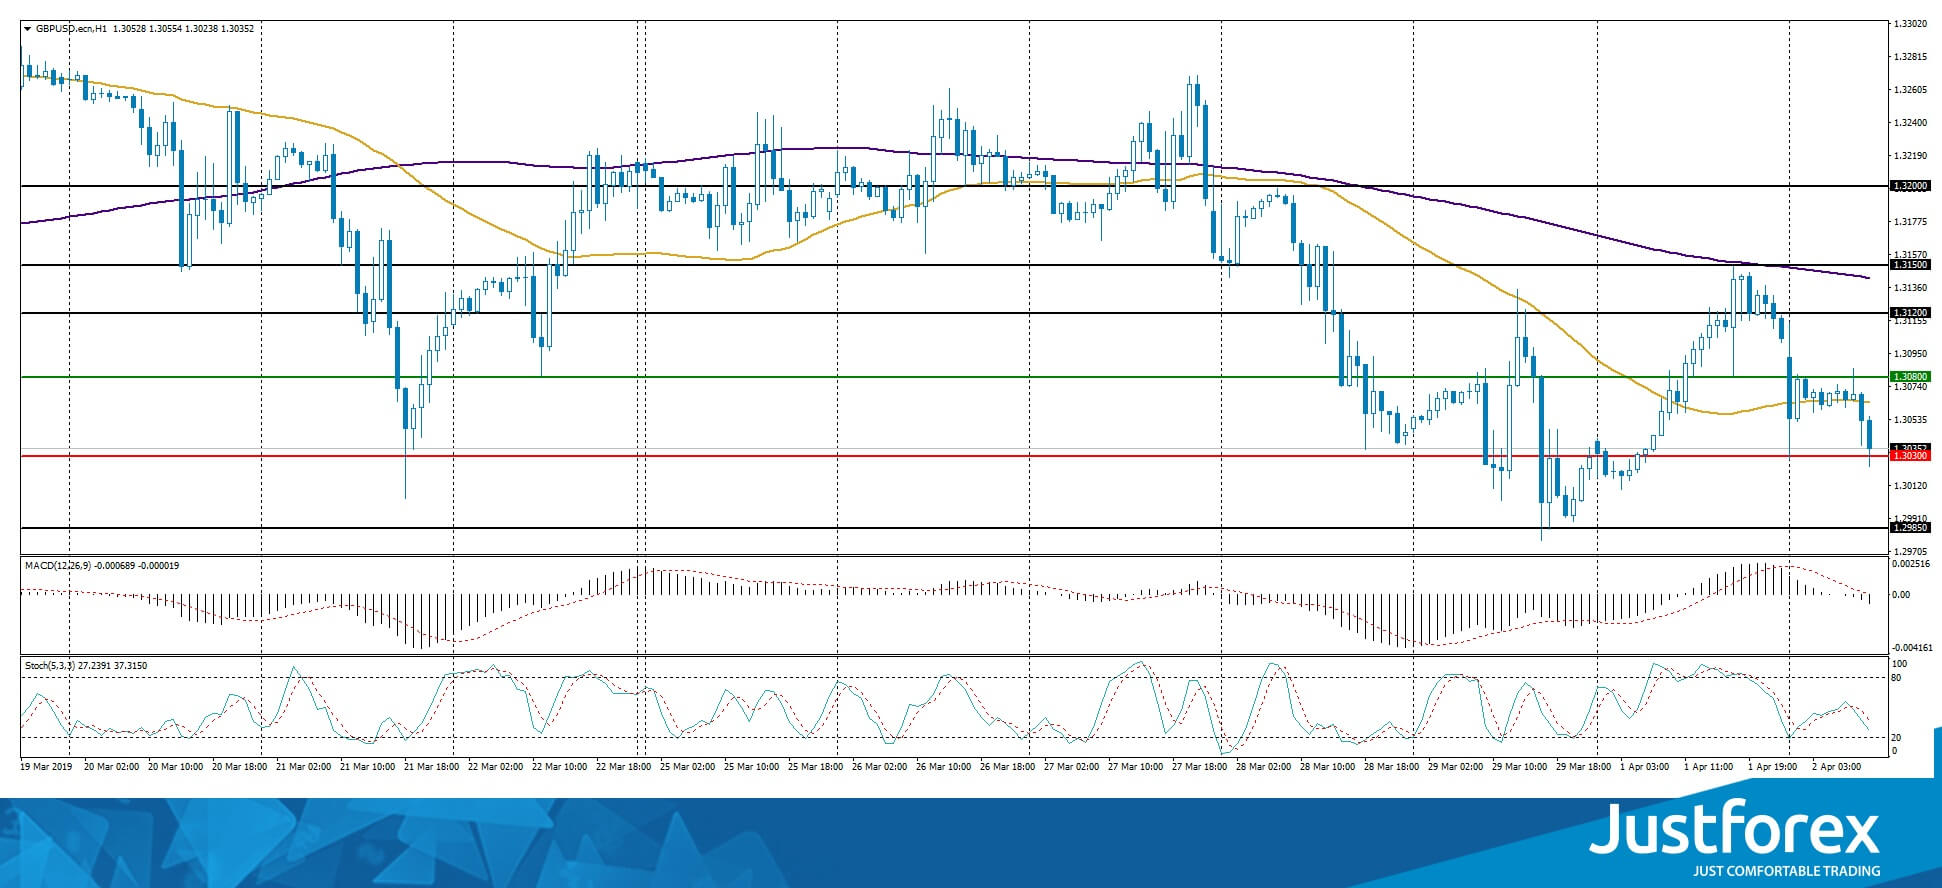
The indicators point to the power of the sellers, the price fixed below 50 MA and 200 MA.
The MACD histogram is in the negative zone, which points to the bearish mood.
The Stochastic Oscillator is in the neutral zone, the %K line is below the %D line which gives a signal to sell GBP/USD.
Trading recommendations
Support levels: 1.30300, 1.29850
Resistance levels: 1.30800, 1.31200, 1.31500
If the price fixes below 1.30300, expect the quotes to fall toward 1.29850-1.29700.
Alternatively, the quotes can grow toward 1.31200-1.31500.
The USD/CAD currency pair
Technical indicators of the currency pair:
Prev Open: 1.33465
Open: 1.33046
% chg. over the last day: -0.27
Day’s range: 1.33027 – 1.33371
52 wk range: 1.2248 – 1.3664
CAD kept strengthening against the USD. The quotes updated the local minimums and found support at 1.33100. 1.33400 acts as a mirror support. The demand for USD weakened after ambiguous economic releases while CAD is supported by the oil quotes dynamics. The currency pair can descend further, you should open positions from the key levels.
The Economic News Feed for 02.04.2019 is calm.
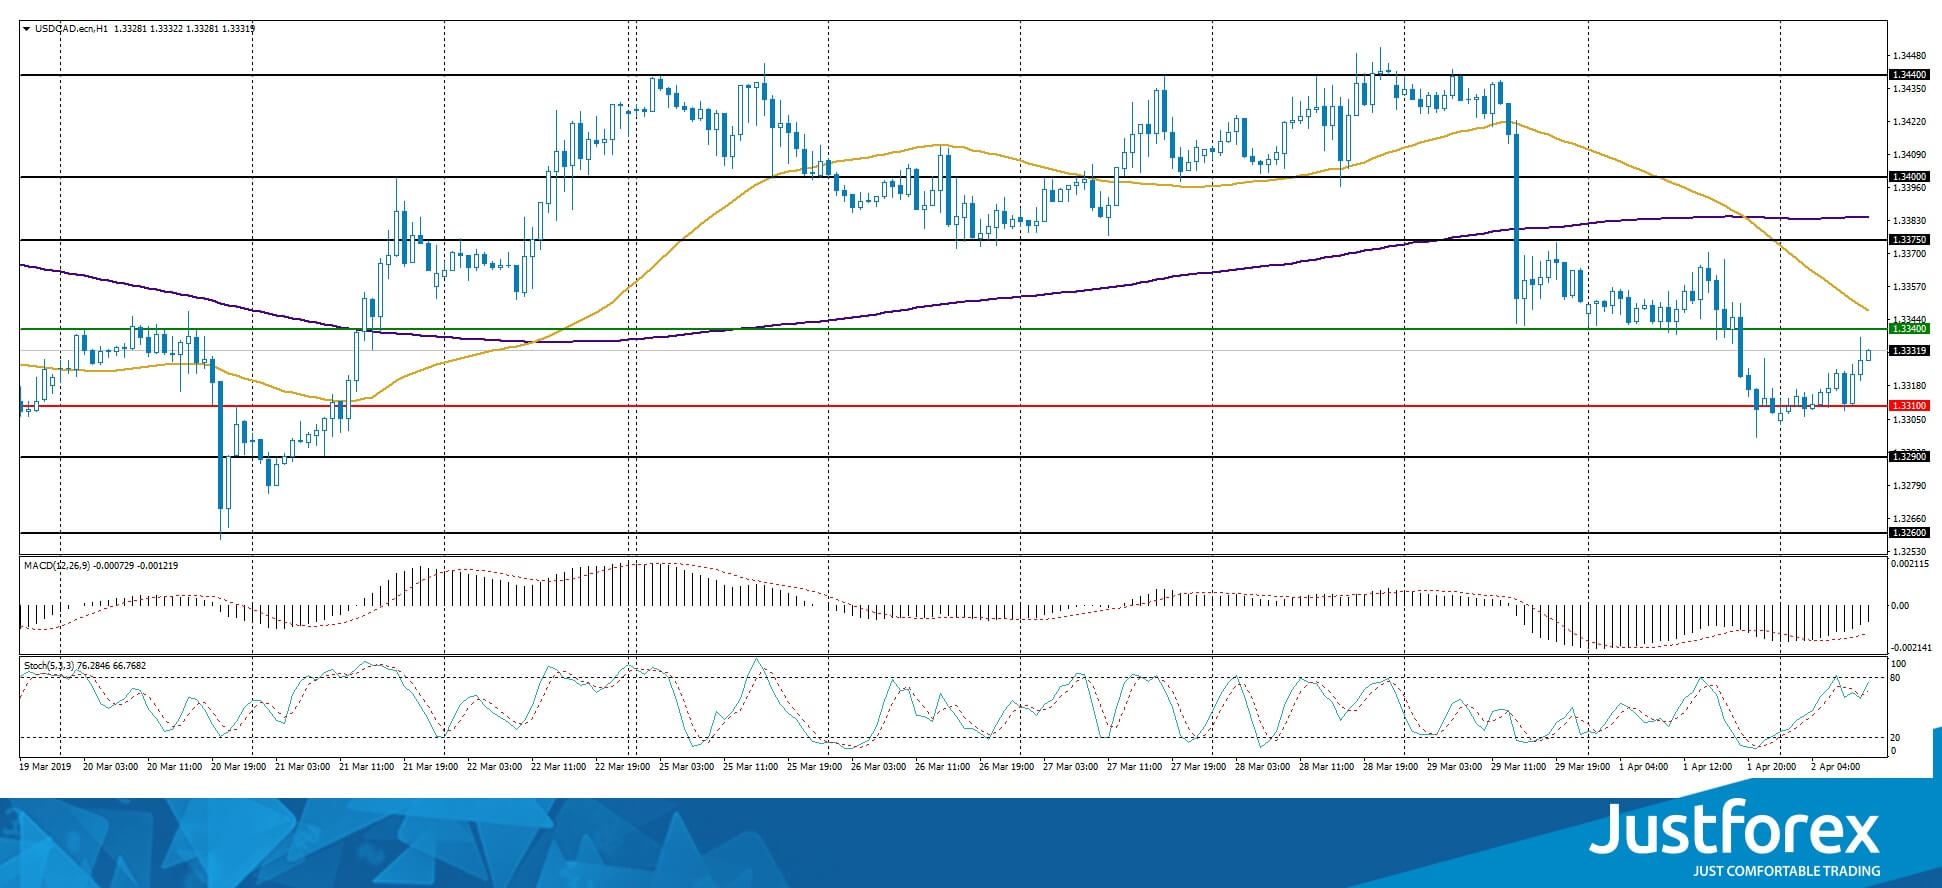
The price fixed below 50 MA and 200 MA, which points to the power of the sellers.
The MACD histogram is in the negative zone but above the signal line which gives a weak signal to sell USD/CAD.
The Stochastic Oscillator is near the overbought zone, the %K line is above the %D line which points to the bullish mood.
Trading recommendations
Support levels: 1.33100, 1.32900, 1.32600
Resistance levels: 1.33400, 1.33750, 1.34000
If the price fixes below 1.33100, expect the qutoes to fall toward 1.32700-1.32500.
Alternatively, the qutoes can grow toward 1.33700-1.33900.
The USD/JPY currency pair
Technical indicators of the currency pair:
Prev Open: 110.015
Open: 111.344
% chg. over the last day: +0.42
Day’s range: 111.285 – 111.455
52 wk range: 104.56 – 114.56
USD/JPY remains in a bullish mood and updated the local maximums yesterday. The quotes are consolidating around 111.450. 111.150 acts as the closest support. Keep an eye on the economic releases and the US Treasury bonds yield. You should open positions from the key levels.
The Economic News Feed for 02.04.2019 is calm.
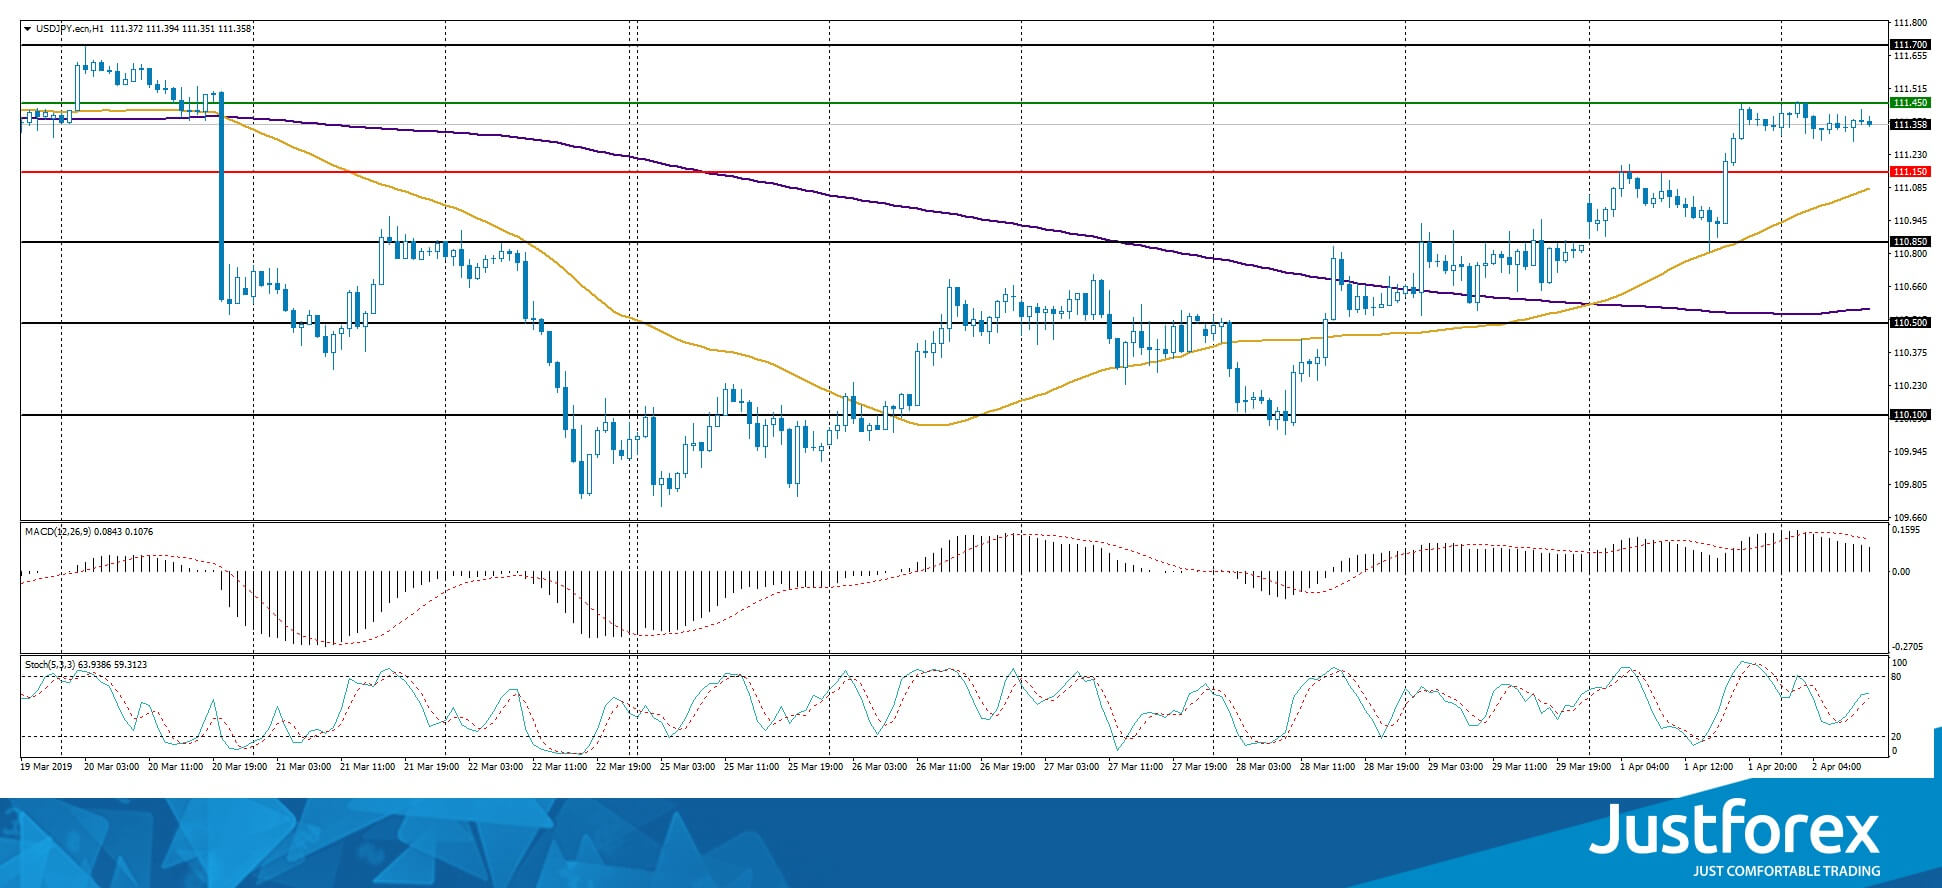
The price fixed above 50 MA and 200 MA which points to the power of the buyers.
The MACD histogram is in the positive zone but below the signal line which gives a weak signal to buy USD/JPY.
The Stochastic Oscillator is in the neutral zone, the %K line is above the %D line which also points to the bullish mood.
Trading recommendations
Support levels: 111.150, 110.850, 110.500
Resistance levels: 111.450, 111.700, 112.000
If the price fixes above 111.450, expect the quotes to grow toward 112.000.
Alternatively, the quotes can fall toward 110.850-110.600.


