
The EUR/USD currency pair
Technical indicators of the currency pair:
Prev Open: 1.12189
Open: 1.12141
% chg. over the last day: -0.04
Day’s range: 1.12103 – 1.12323
52 wk range: 1.1214 – 1.2557
EUR\USD shows an ambiguous technical picture. The trading instrument is consolidating. EUR\USD are testing the local support and resistance levels at 1.12100 and 1.12350 respectively. The financial market participants are evaluating the US March Labour Market report. USD is under pressure due to the descend of the US Treasury Bonds’ yield. You should open positions from the key levels.
The Economic News Feed for 08.04.2019 is calm.
Industrial Orders Volume (US) – 17:30 (GMT+3:00);
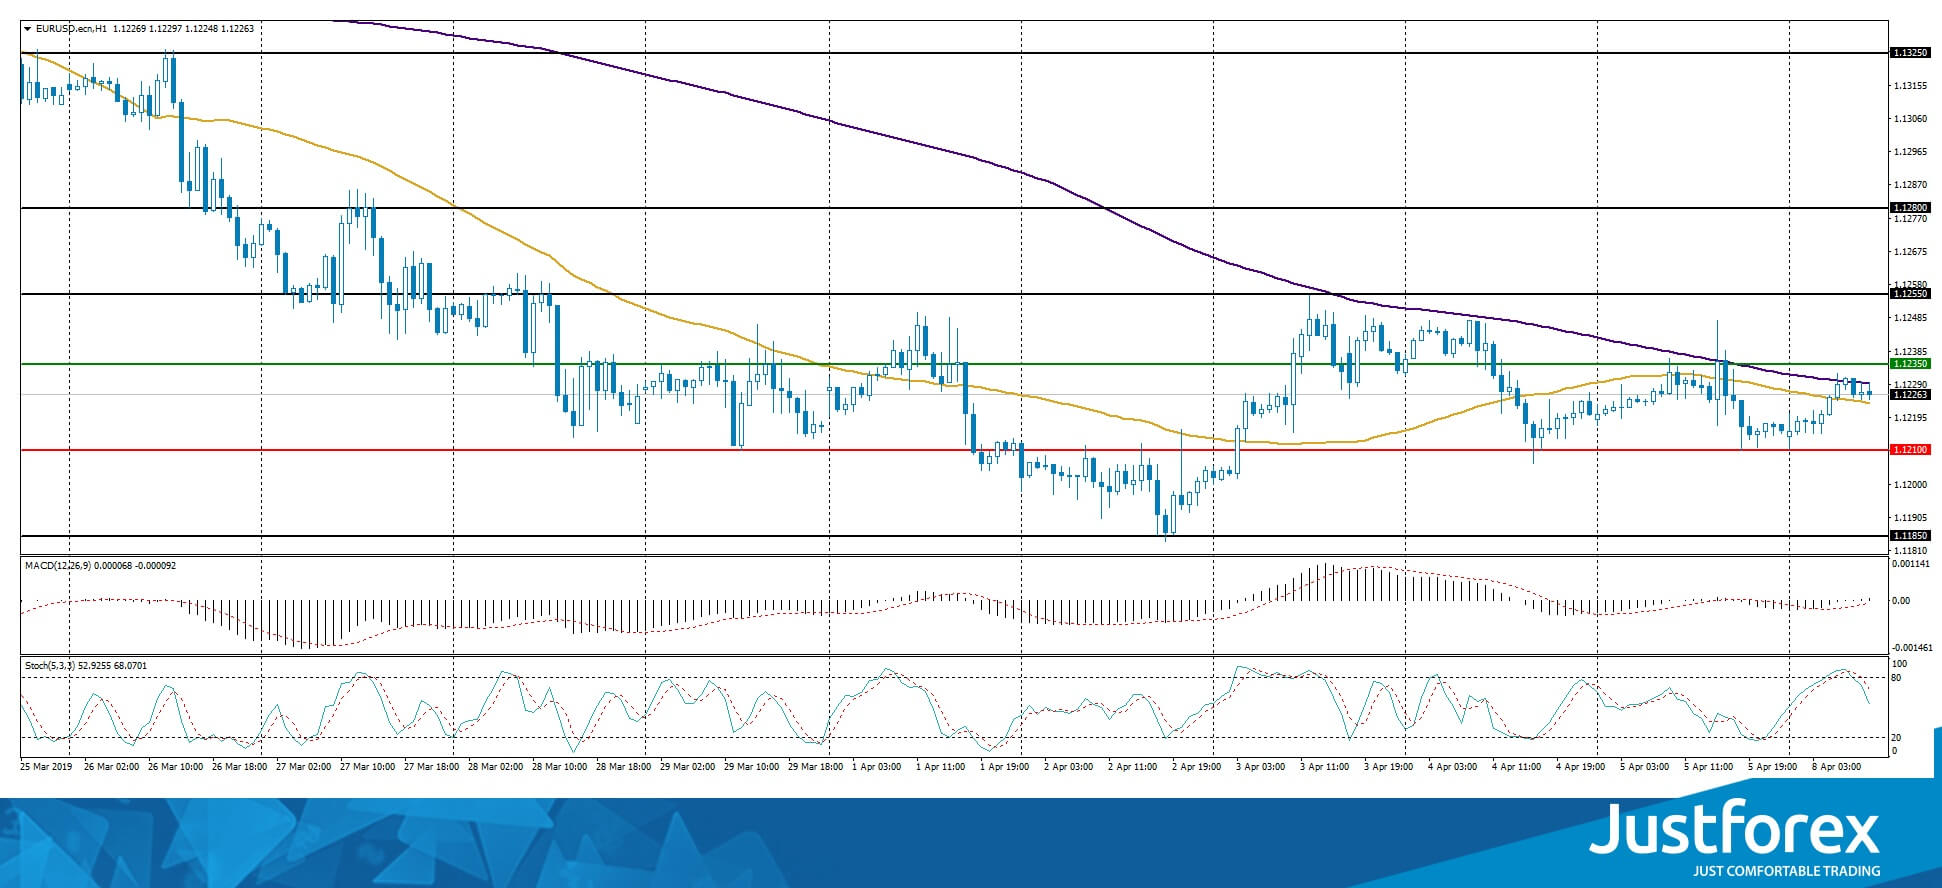
The indicators do not provide precise data, the price has crossed 50 MA and 200 MA.
The MACD histogram is close to 0.
The Stochastic Oscillator is in the neutral zone, the %K line is crossing the %D line. There are no signals at the moment.
Trading recommendations
Support levels: 1.12100, 1.11850, 1.11500
Resistance levels: 1.12350, 1.12550, 1.12800
If the price fixes at 1.12100, expect the quotes to fall toward 1.11800-1.11500.
Alternatively, the quotes can recover toward 1.12500-1.12700.
The GBP/USD currency pair
Technical indicators of the currency pair:
Prev Open: 1.30733
Open: 1.30350
% chg. over the last day: -0.31
Day’s range: 1.30220 – 1.30721
52 wk range: 1.2438 – 1.4378
GBP\USD is consolidating. The technical picture is ambiguous. GBP is testing the local support and resistance levels at 1.30300 and 1.30700. The trading instrument has a tendency to descned. The financial market participants are keeping a close eye on Brexit. Theresa May recently sent a letter to Brussel with a request to postpone Brexit until June 30. Keep an eye on this issue and open positions from the key levels.
The Economic News Feed for 08.04.2019 is calm.
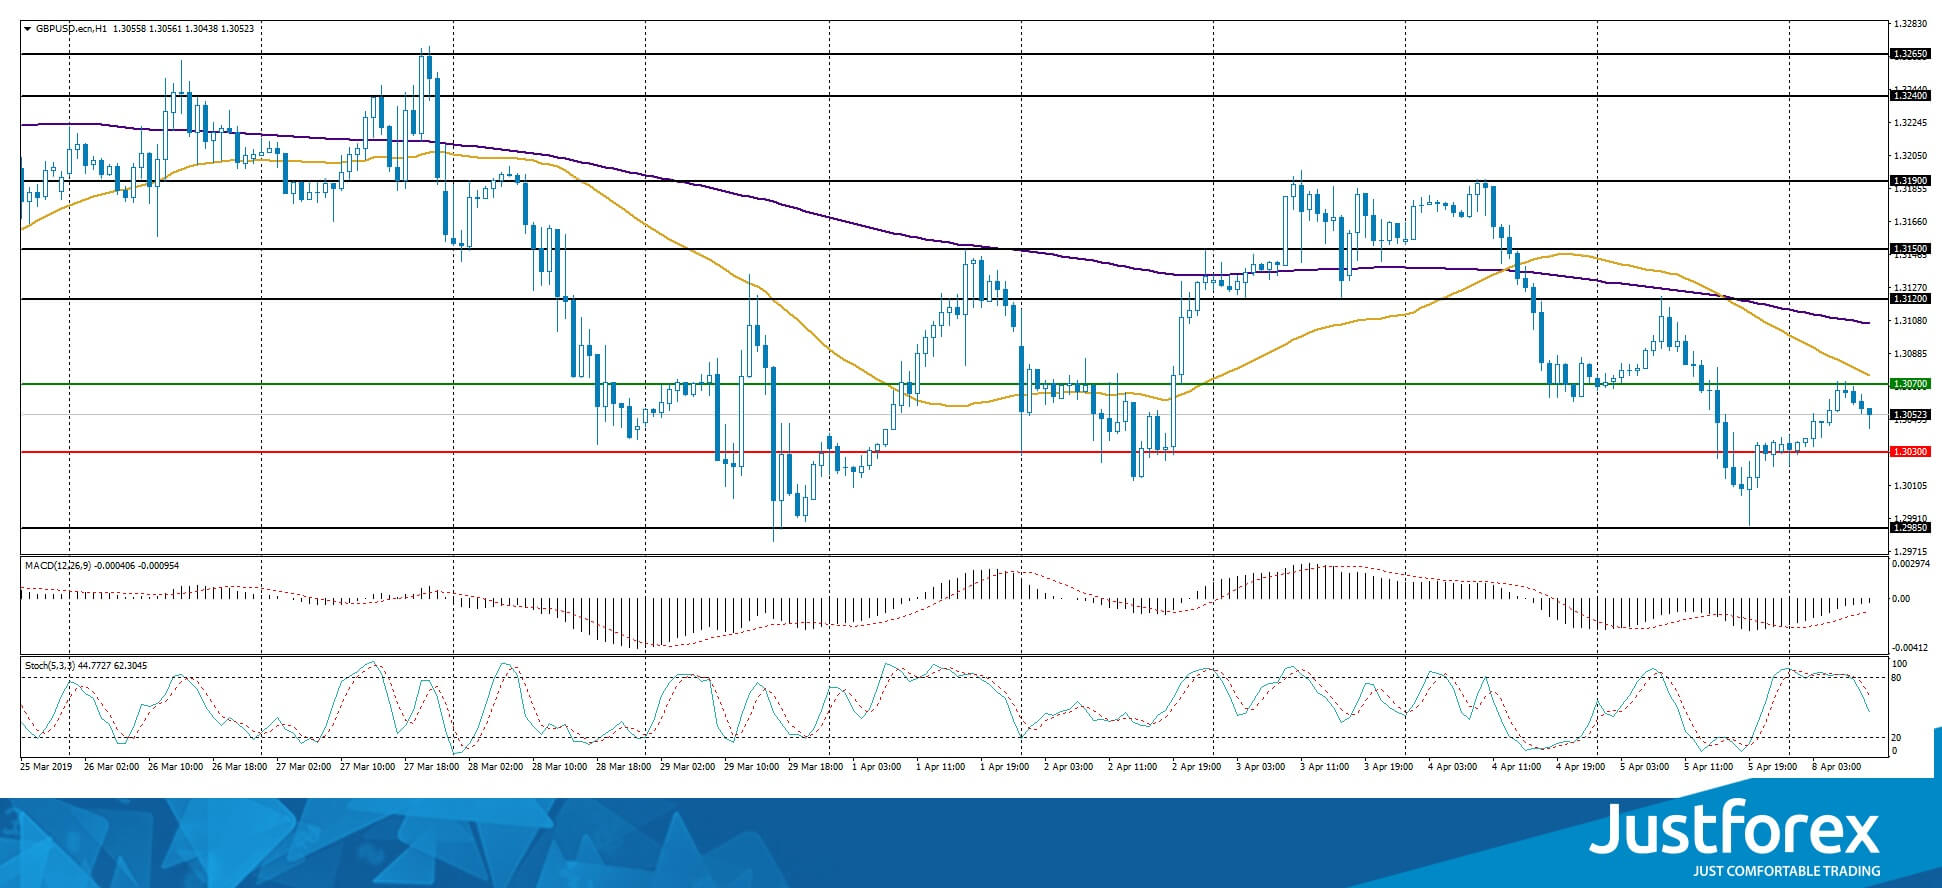
The indicators point to the power of the sellers, 50 MA fixed below 200 MA.
The MACD histogram is in the negative zone but above the signal line, which gives a weak signal to sell GBP/USD.
The Stochastic Oscillator is in the neutral zone, the %K line is below the %D line which points to the bearish mood.
Trading recommendations
Support levels: 1.30300, 1.29850, 1.29500
Resistance levels: 1.30700, 1.31200, 1.31500
If the quotes fix below 1.30300, expect further fall toward 1.29900-1.29700.
Alternatively, the quotes can grow toward 1.31000-1.31200.
The USD/CAD currency pair
Technical indicators of the currency pair:
Prev Open: 1.33581
Open: 1.33819
% chg. over the last day: +0.18
Day’s range: 1.33691 – 1.33871
52 wk range: 1.2248 – 1.3664
USD/CAD was in a bullish mood on Friday and updated the local maximum. Currently it is stabilizing around 1.33650 and 1.34000. The pressure on the USD is caused by the lowering US Treasury bonds’ yield. The bullish mood on the oil market supports CAD. The currency pair has a tendency to descend, you should open positions from the key levels.
At 15:30 (GMT+3:00) we expect the Canadian real estate market report.
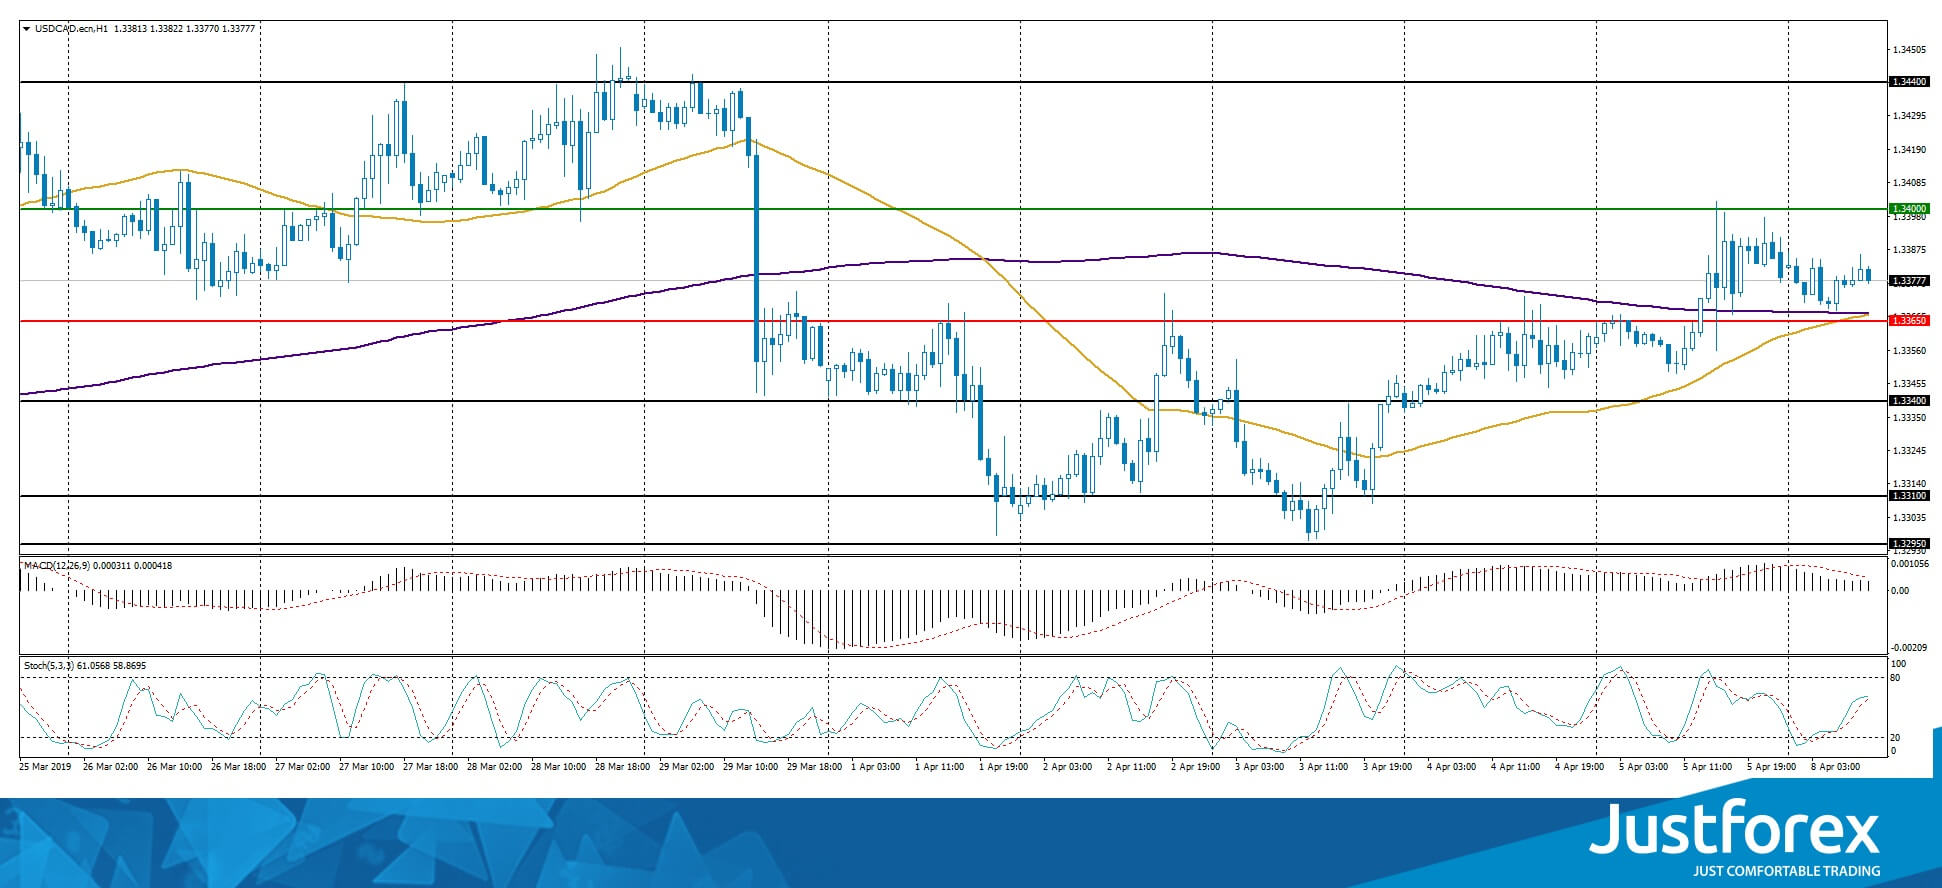
The indicators do not provide precise signals, 50 MA has crossed 200 MA.
The MACD histogram is in the positive zone but below the signal line which gives a weak signal to buy USD\CAD
The Stochastic Oscillator is close to the neutral zone, the %K line is above the %D line which points to the bullish mood.
Trading recommendations
Support levels: 1.33650, 1.33400, 1.33100
Resistance levels: 1.34000, 1.34400
If the price fixes below 1.33650, consider selling USD/CAD, the price is expected to fall toward 1.33400-1.33100.
Alternatively, the quotes can grow toward 1.34200-1.34400.
The USD/JPY currency pair
Technical indicators of the currency pair:
Prev Open: 111.643
Open: 111.666
% chg. over the last day: +0.05
Day’s range: 111.343 – 111.740
52 wk range: 104.56 – 114.56
USD/JPY started to descend. A technical correction is possible soon, due to the afthermath of a long rally. The key levels are 111.350 and 111.750. Keep an eye on the US Treasury bonds’ yield and open positions from the key levels.
The Economic News Feed for 08.04.2019 is calm.
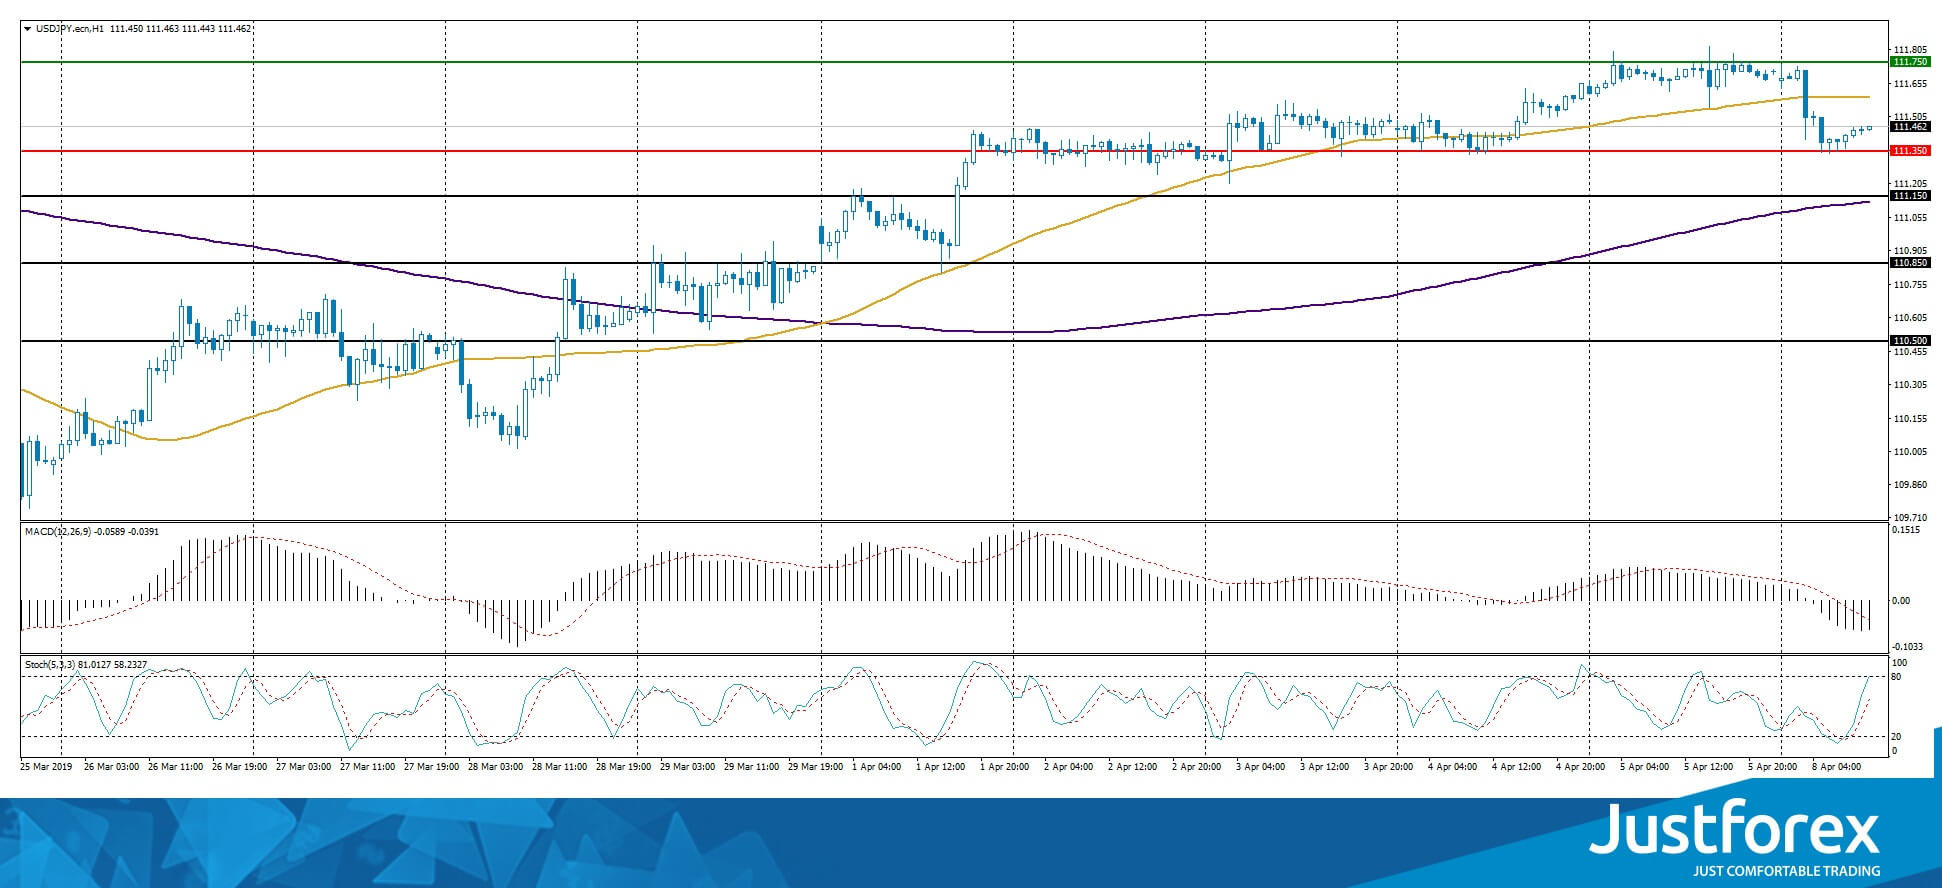
The indicators do not provide precise signals, the price fixed between 50 MA and 200 MA.
The MACD histogram is in the negative zone and below the signal line which gives a strong signal to buy USD/JPY.
The Stochastic Oscillator is in the neutral zone, the %K line is above the %D line which points to the bullish mood.
Trading recommendations
Support levels: 111.450, 111.150, 110.850
Resistance levels: 111.750, 112.000
If the price fixes above 111.350, expect further growth toward 111.000-110.800.
Alternatively, the quotes can fall toward 112.000.


