
Key Highlights
- Gold price topped near the $1,346 level in Feb 2019 and later corrected lower.
- There is a crucial declining channel formed with resistance at $1,292 on the daily chart of XAU/USD.
- China’s GDP grew 6.4% in Q1 2019 (YoY), more than the 6.3% forecast.
- The US Retail Sales in March 2019 could increase 0.9% (MoM), better than the last -0.2%.
Gold Price Technical Analysis
There was a strong rise in gold price in January and February 2019 above $1,300 against the US Dollar. The price even broke the $1,325 resistance, formed a top near $1,346, and recently corrected lower.
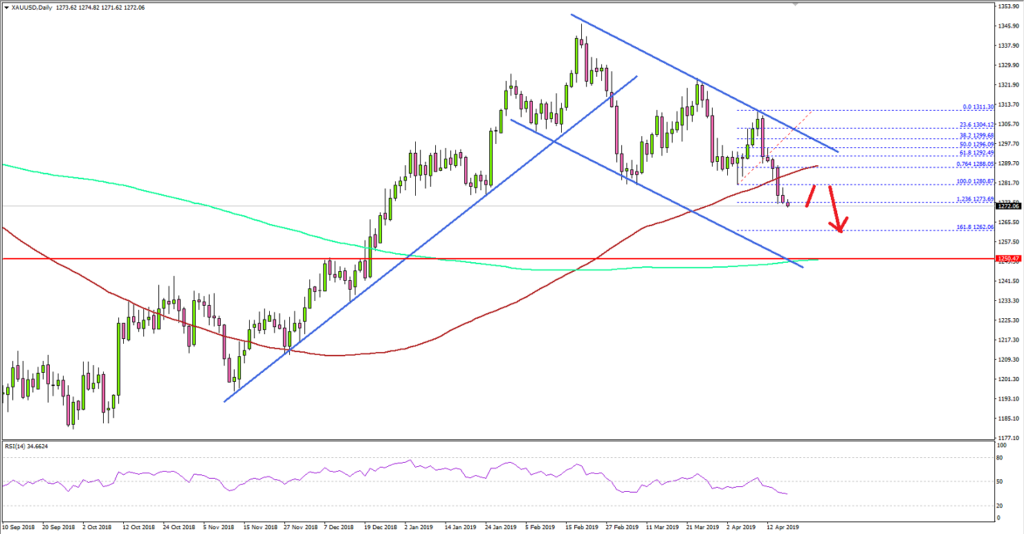
The daily chart of XAU/USD indicates that the price declined below the $1,320 support level and a major bullish trend line to move into a bearish zone. The price even broke the $1,310 and $1,300 support levels to enter a bearish zone.
Intermediately, there were a couple of swing lows formed near $1,282. The last low was near $1,280 before the price rebounded above $1,300. However, the price failed to clear the $1,310 resistance and declined back below $1,300.
There was a break below the $1,280 low and the price tested the 1.236 Fib extension level of the last wave from the $1,280 low to $1,311 high.
It seems like there is a crucial declining channel in place with resistance at $1,292 on the same chart. Therefore, there is a risk of more losses below the $1,270 level in the near term.
The next major support is at $1,262 and the 1.618 Fib extension level of the last wave from the $1,280 low to $1,311 high. However, the main support is at $1,250 and the 200-day simple moving average (green).
Looking at the major pairs, EUR/USD recovered recently above 1.1250, but GBP/USD remains at a risk of more losses below 1.3050.
Economic Releases to Watch Today
- Germany’s Manufacturing PMI for April 2019 (Preliminary) – Forecast 45.0, versus 44.1 previous.
- Germany’s Services PMI for April 2019 (Preliminary) – Forecast 55.1, versus 55.4 previous.
- Euro Zone Manufacturing PMI April 2019 (Preliminary) – Forecast 47.9, versus 47.5 previous.
- Euro Zone Services PMI for April 2019 (Preliminary) – Forecast 53.2, versus 53.3 previous.
- UK Retail Sales for March 2019 (YoY) – Forecast +4.6%, versus +4.0% previous.
- UK Retail Sales for March 2019 (MoM) – Forecast -0.3%, versus +0.4% previous.
- US Manufacturing PMI for April 2019 (Preliminary) – Forecast 52.8, versus 52.4 previous.
- US Services PMI for April 2019 (Preliminary) – Forecast 55.0, versus 55.3 previous.
- US Initial Jobless Claims – Forecast 205K, versus 196K previous.
- US Retail Sales March 2019 (MoM) – Forecast +0.9%, versus -0.2% previous.


