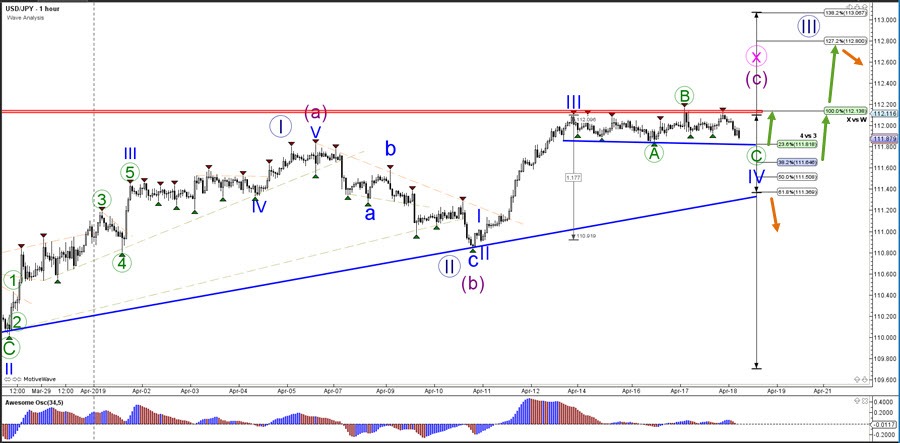
The USD/JPY bull flag chart pattern usually suggests that price will continue higher with the uptrend but the strong daily resistance (red) line could be a tough level to break. A bearish bounce however could simply be a retracement within the uptrend, which is why a bearish reversal becomes more likely when price breaks below the next support trend line as indicated by the orange arrow. A break above the 100% Fibonacci level could see price make that bull break.
The USD/JPY seems to be in a wave 4 (blue) corrective pattern, which is why the Fibonacci levels of wave 4 vs 3 could act as support and potential bouncing spot. The wave 4 pattern becomes less likely if price breaks below the 61.8% Fibonacci retracement. A bullish break first aims at 112.50 and then 112.80.