
Key Highlights
- The US Dollar settled above the 110.60 and 111.50 resistances against the Japanese Yen.
- USD/JPY could attempt to surpass a crucial bearish trend line at 112.60 on the daily chart.
- The US Retail Sales in March 2019 increased 1.6% (MoM), more than the +0.9% forecast.
- The US Housing Starts in March 2019 could increase 6.5% (MoM), whereas the last was -8.7%.
USDJPY Technical Analysis
The US Dollar started a strong upward move from the 109.80 support area against the Japanese Yen. The USD/JPY broke the 110.60 and 111.50 resistances to move into a positive zone.
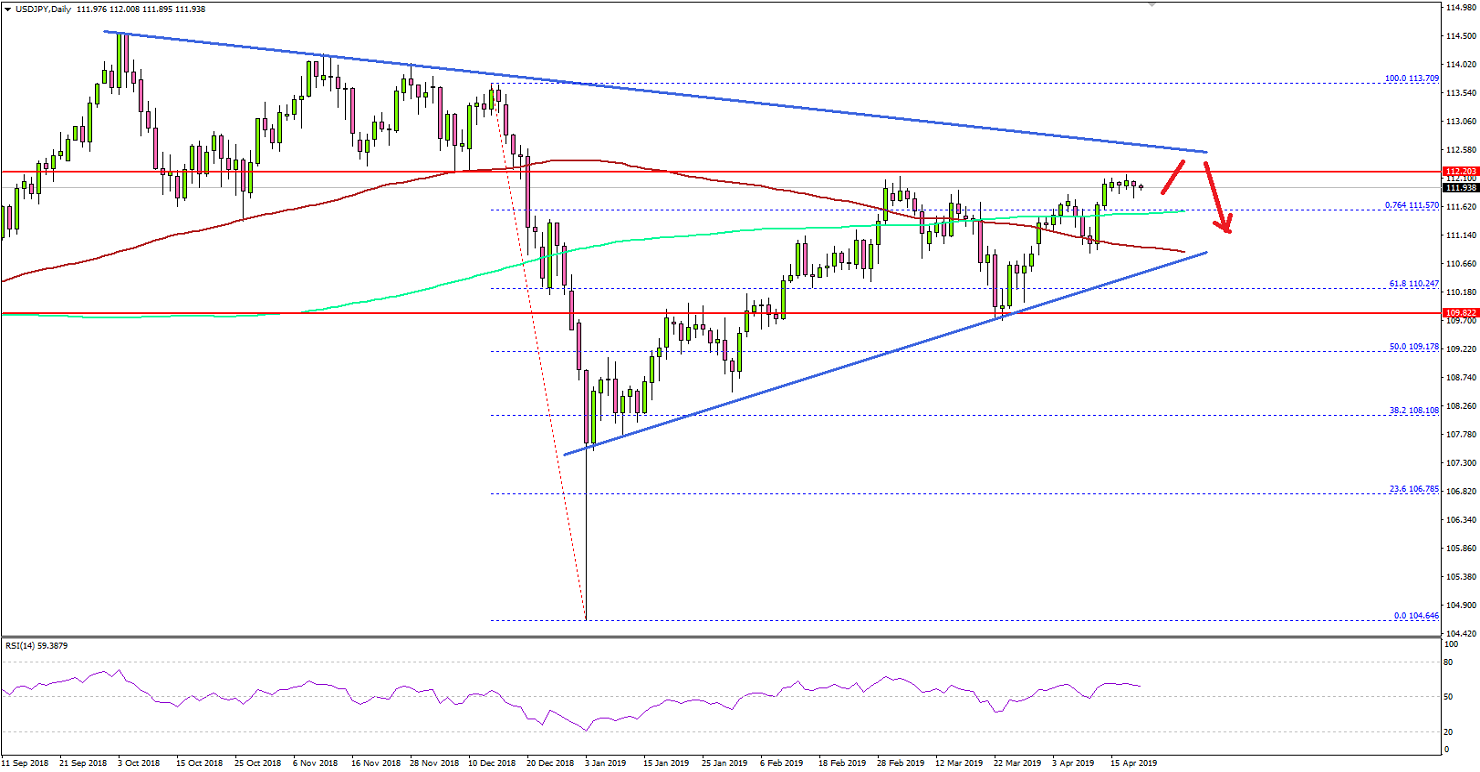
Looking at the daily chart, the pair followed a solid bullish path from the 109.70 swing low and traded above the key 110.60 resistance plus the 100-day simple moving average (red).
It opened the doors for more gains above 111.00 and the 76.4% Fib retracement level of the significant drop from the 113.70 high to 104.64 low. The pair even settled above 111.50 and the 200-day simple moving average (green).
However, there is an important resistance formed near 112.50 and a crucial bearish trend line at 112.60 on the same chart. It seems like the pair is likely to struggle near 112.50-112.60 in the near term.
If there is a clear break above the 112.50 resistance and the trend line, there could be further upsides above 113.00 and 113.50. On the flip side, a failure to clear the trend line could trigger a downside correction towards the 110.60 support and the 100-day SMA.
Fundamentally, the US Retail Sales report for March 2019 was released by the US Census Bureau. The market was looking for an increase of 0.9% in sales in March 2019, compared with the previous month.
The actual result was better than the forecast, as there was a 1.6% rise in sales, which was a lot better compared to the last decline of 0.2%. Looking at the Retail Sales ex Autos, there was an increase of 1.2%, more than the 0.7% forecast.
The report added that:
Total sales for the January 2019 through March 2019 period were up 2.9 percent (±0.7 percent) from the same period a year ago. The January 2019 to February 2019 percent change was unrevised from down 0.2 percent (±0.2 percent)*.
Overall, the USD/JPY could make an attempt to surpass the 112.50 and 112.60 resistance levels, but it won’t be easy for the bulls to gain strength above the trend line.
Economic Releases to Watch Today
- US Housing Starts March 2019 (MoM) – Forecast 1.230M, versus 1.162M previous.
- US Building Permits March 2019 (MoM) – Forecast 1.230M, versus 1.219M previous.


