
The EUR/USD currency pair
Technical indicators of the currency pair:
Prev Open: 1.12567
Open: 1.12260
% chg. over the last day: -0.31
Day’s range: 1.12010 – 1.12260
52 wk range: 1.1214 – 1.2557
Yesterday USD strengthened against the competition. The EUR/USD quotes lowered by 50 points and reached 1.12000. 1.12300 acts as a mirror resistance. The demand for the USD grew due to positive US real estate reports. The currency pair has a tendency to descend. The investors are waiting for important releases from Germany. You should open positions from the key levels.
The Economic News Feed for 24.04.2019:
Business Climate Index (EU) – 11:00 (GMT+3:00);
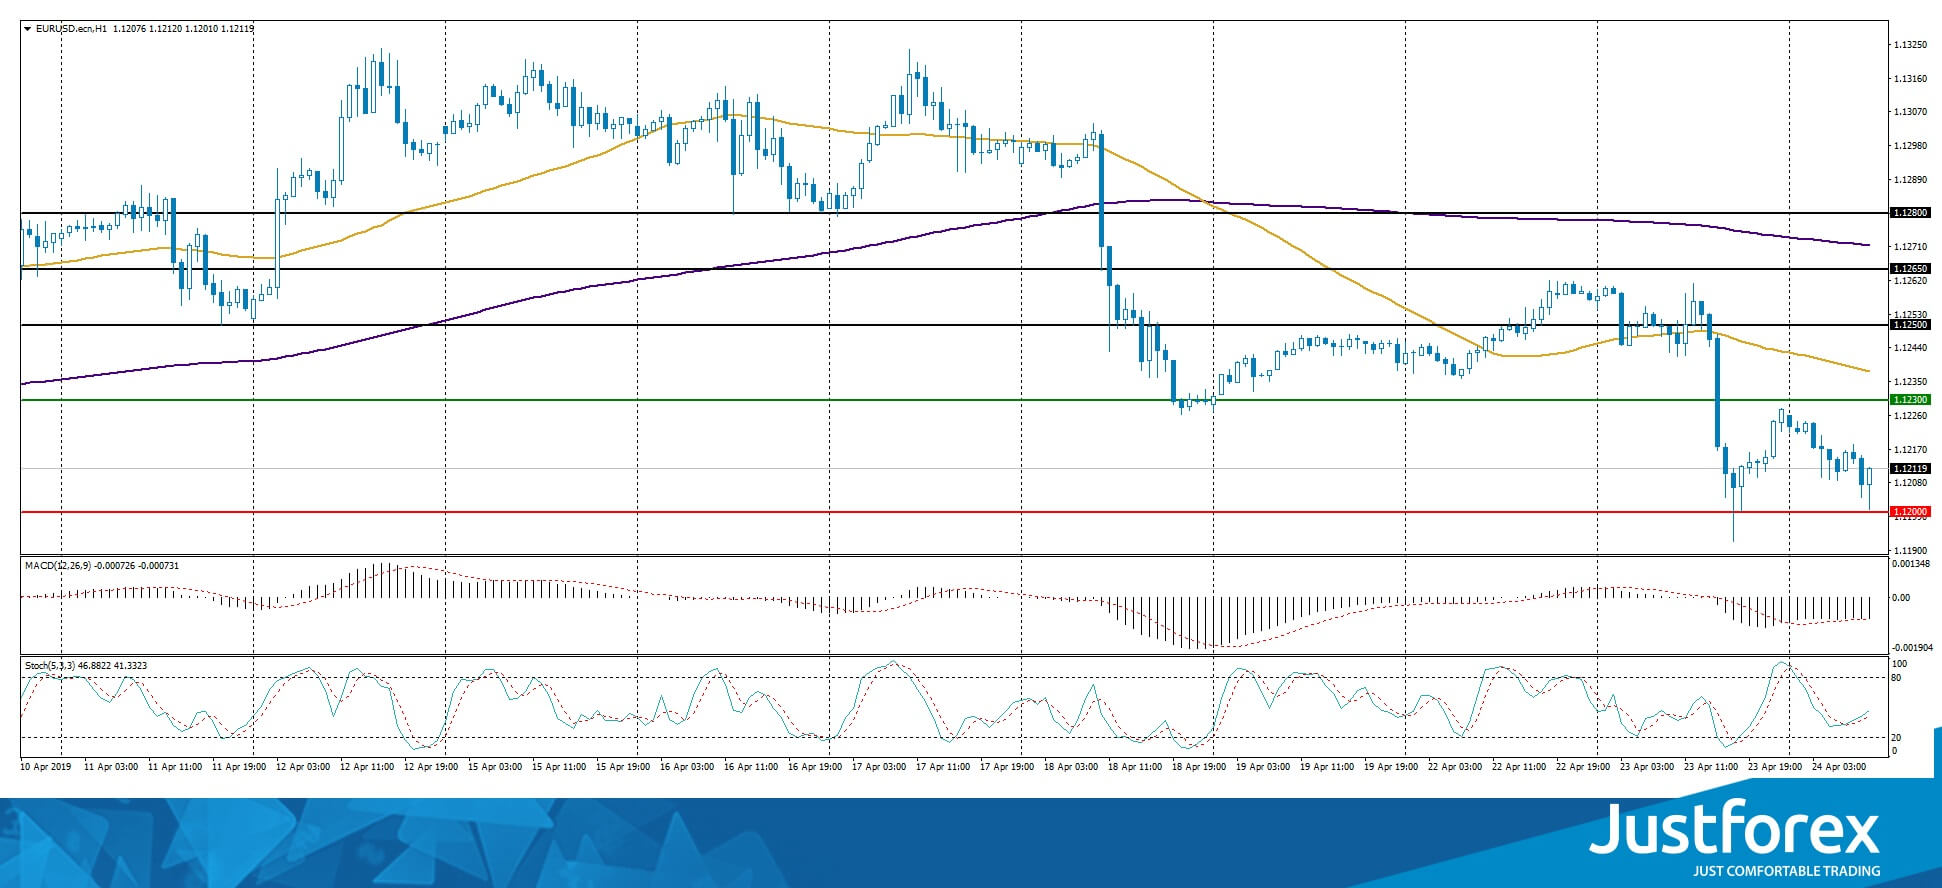
The price fixed below 50 MA and 200 MA which points to the power of the buyers.
The MACD histogram is in the negative zone and keeps falling, which points to the bearish mood.
The Stochastic Oscillator is in the neutral zone, the %K line is above the %D line which gives a signal to buy EUR/USD.
Trading recommendations
Support levels: 1.12000, 1.11500
Resistance levels: 1.12300, 1.12500, 1.12650
If the price fixes below 1.12000, expect further descend toward 1.11600-1.11400.
Alternatively, the quotes can recover toward 1.12500-1.12650.
The GBP/USD currency pair
Technical indicators of the currency pair:
Prev Open: 1.29812
Open: 1.29369
% chg. over the last day: -0.37
Day’s range: 1.29151 – 1.29431
52 wk range: 1.2438 – 1.4378
GBP/USD is in a bearish mood. The GBP has updated the two-month minimums. The demand for USD has grown after the positive real estate sales report from the US. The Brexit ambiguousness keeps pushing the GBP down. The British parliament has returned from the Easter holidays, the investors are waiting on more information regarding Brexit. Right now the quotes are consolidating aroun 1.29200-1.29500. The trading instrument has a tendency to descend, you should open positions from the key levels.
The Economic News Feed for 24.04.2019 is calm.
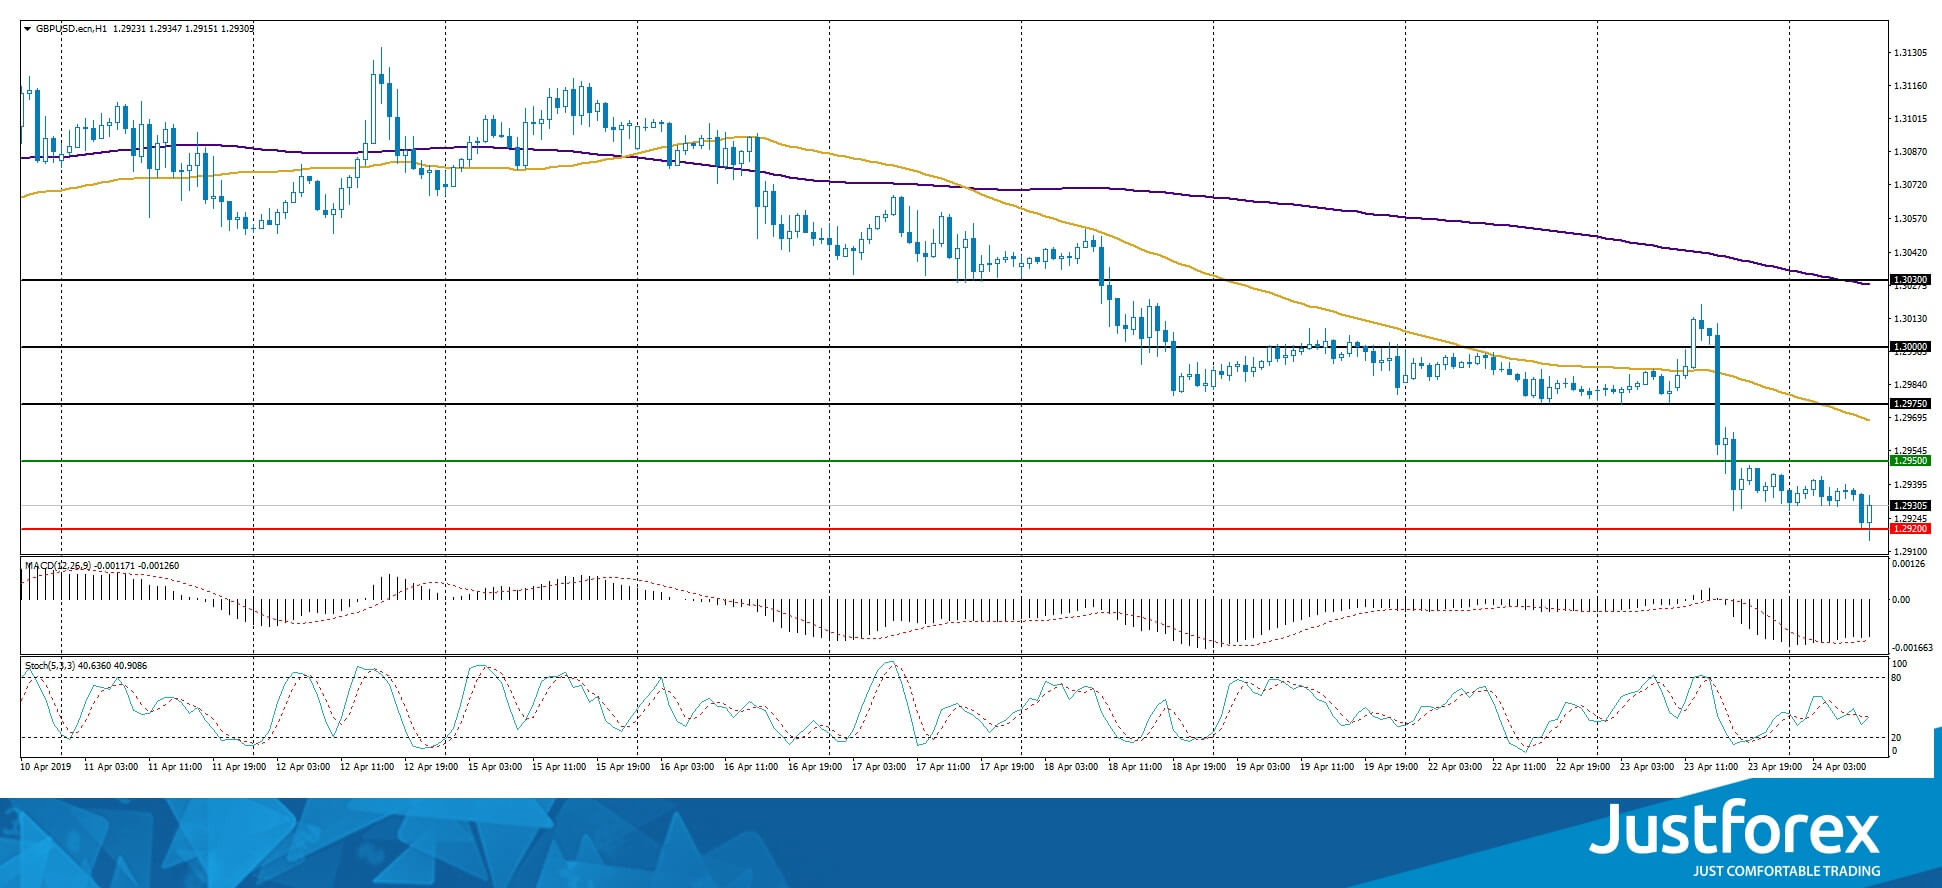
The price fixed below 50 MA and 200 MA which points to the power of the buyers.
The MACD histogram is in the negative zone but above the signal line which points towards the sale GBP/USD.
The Stochastic Oscillator is in the neutral zone, the %K line is crossing the %D line. There are no signals at the moment.
Trading recommendations
Support levels: 1.29200, 1.29000
Resistance levels: 1.29500, 1.29750, 1.30000
If the price fixes below 1.29200, expect further descend towards 1.29000-1.28700.
Alternatively, the quotes can recover toward 1.29750-1.30000.
The USD/CAD currency pair
Technical indicators of the currency pair:
Prev Open: 1.33499
Open: 1.34172
% chg. over the last day: +0.64
Day’s range: 1.34166 – 1.34616
52 wk range: 1.2248 – 1.3664
CAD is weakened against the USD after the decision of the Bank of Canada regarding the key interest rate. During the last two days, the quote grew by 100 points. The trading instrument set the new monthly maximums. The key range is 1.34300-1.34600. The experts are waiting for the Bank of Canada to set the key parameters of monetary policy on the same level. Keep an eye on the comments by the representatives of the Bank. You should open positions from the key levels.
The Economic News Feed for 24.04.2019:
Announcment of the new key interest rate (CAD) – 17:00 (GMT+3:00);
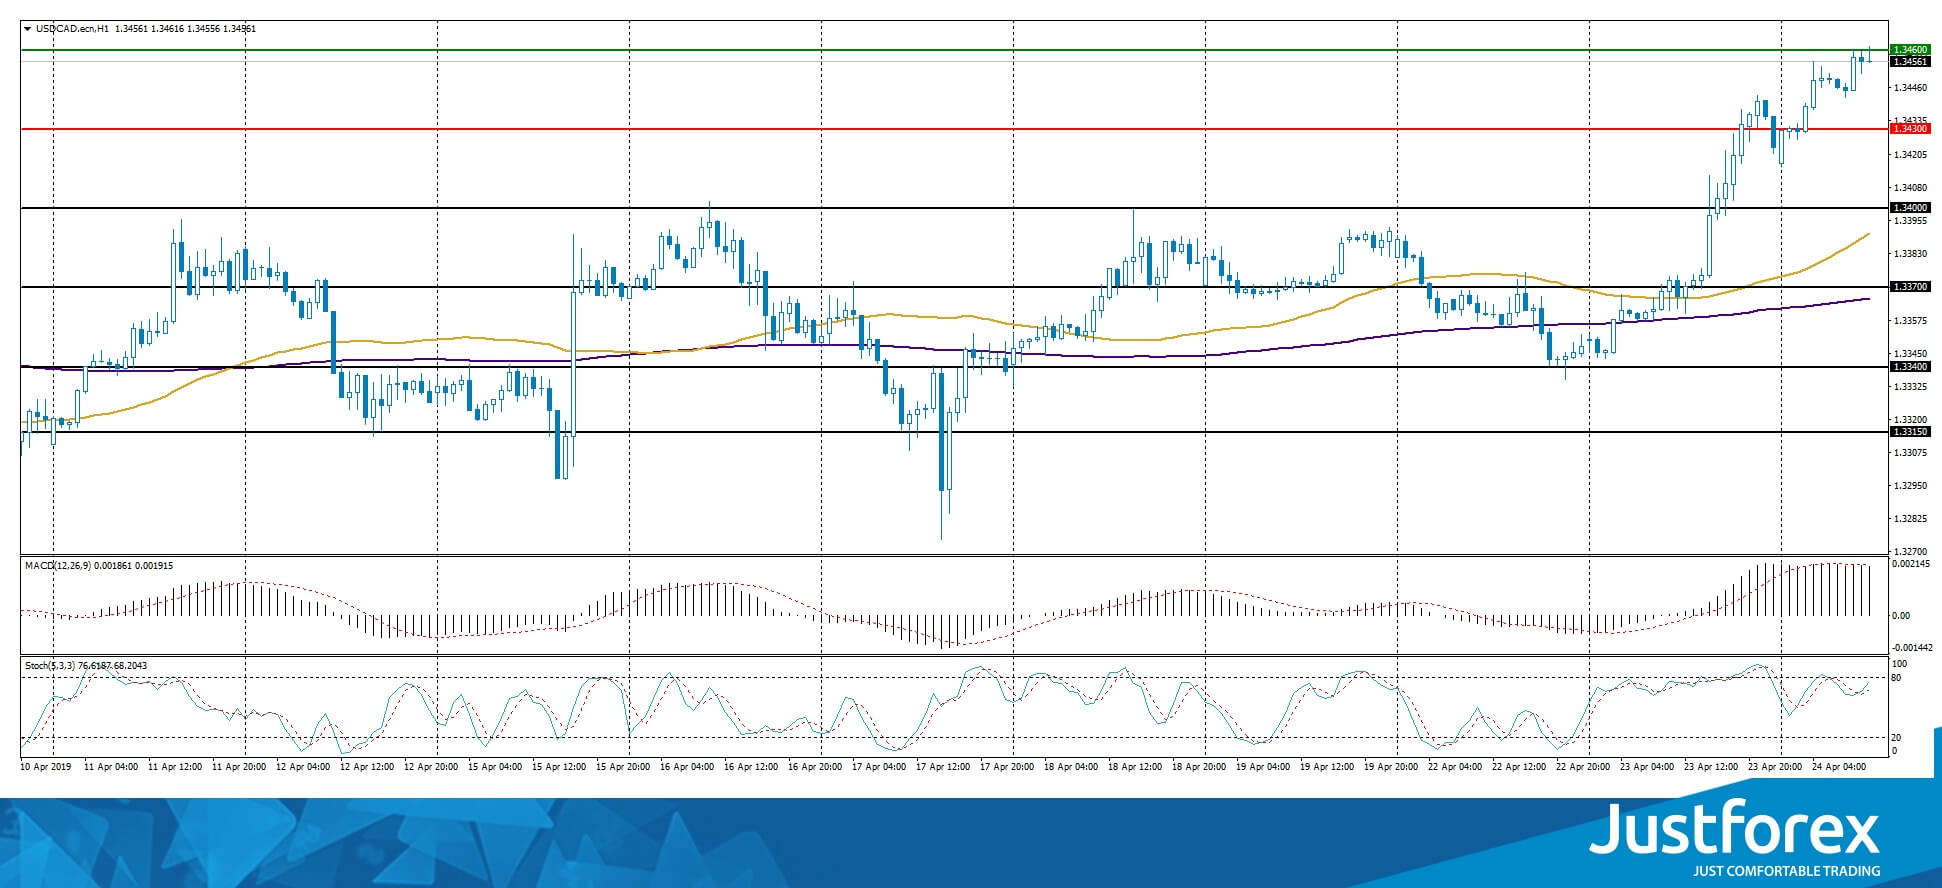
The price fixed above 50 MA and 200 MA which points to the power of the buyers.
The MACD histogram is in the positive zone but below the signal line which gives a weak signal to buy USD/CAD.
The Stochastic Oscillator is in the positive zone but below the signal line which gives a weak signal to buy USD/CAD.
Trading recommendations
Support levels: 1.34300, 1.34000, 1.33700
Resistance levels: 1.34600, 1.35000
If the price fixes above 1.34600, expect further growth toward 1.35000.
Alternatively, the quotes can descend toward 1.34000-1.33700.
The USD/JPY currency pair
Technical indicators of the currency pair:
Prev Open: 111.919
Open: 111.861
% chg. over the last day: -0.05
Day’s range: 111.749 – 111.983
52 wk range: 104.56 – 114.56
USD/JPY remains in a long flat. There is no defined trend. The investors are waiting for additional drivers. The key support and resistance levels are 111.650 and 112.000. USD/JPY has a tendency to descend. Keep an eye on the US Treasury bonds’ yield and open positions from the key levels.
The Economic News Feed for 24.04.2019 is calm.
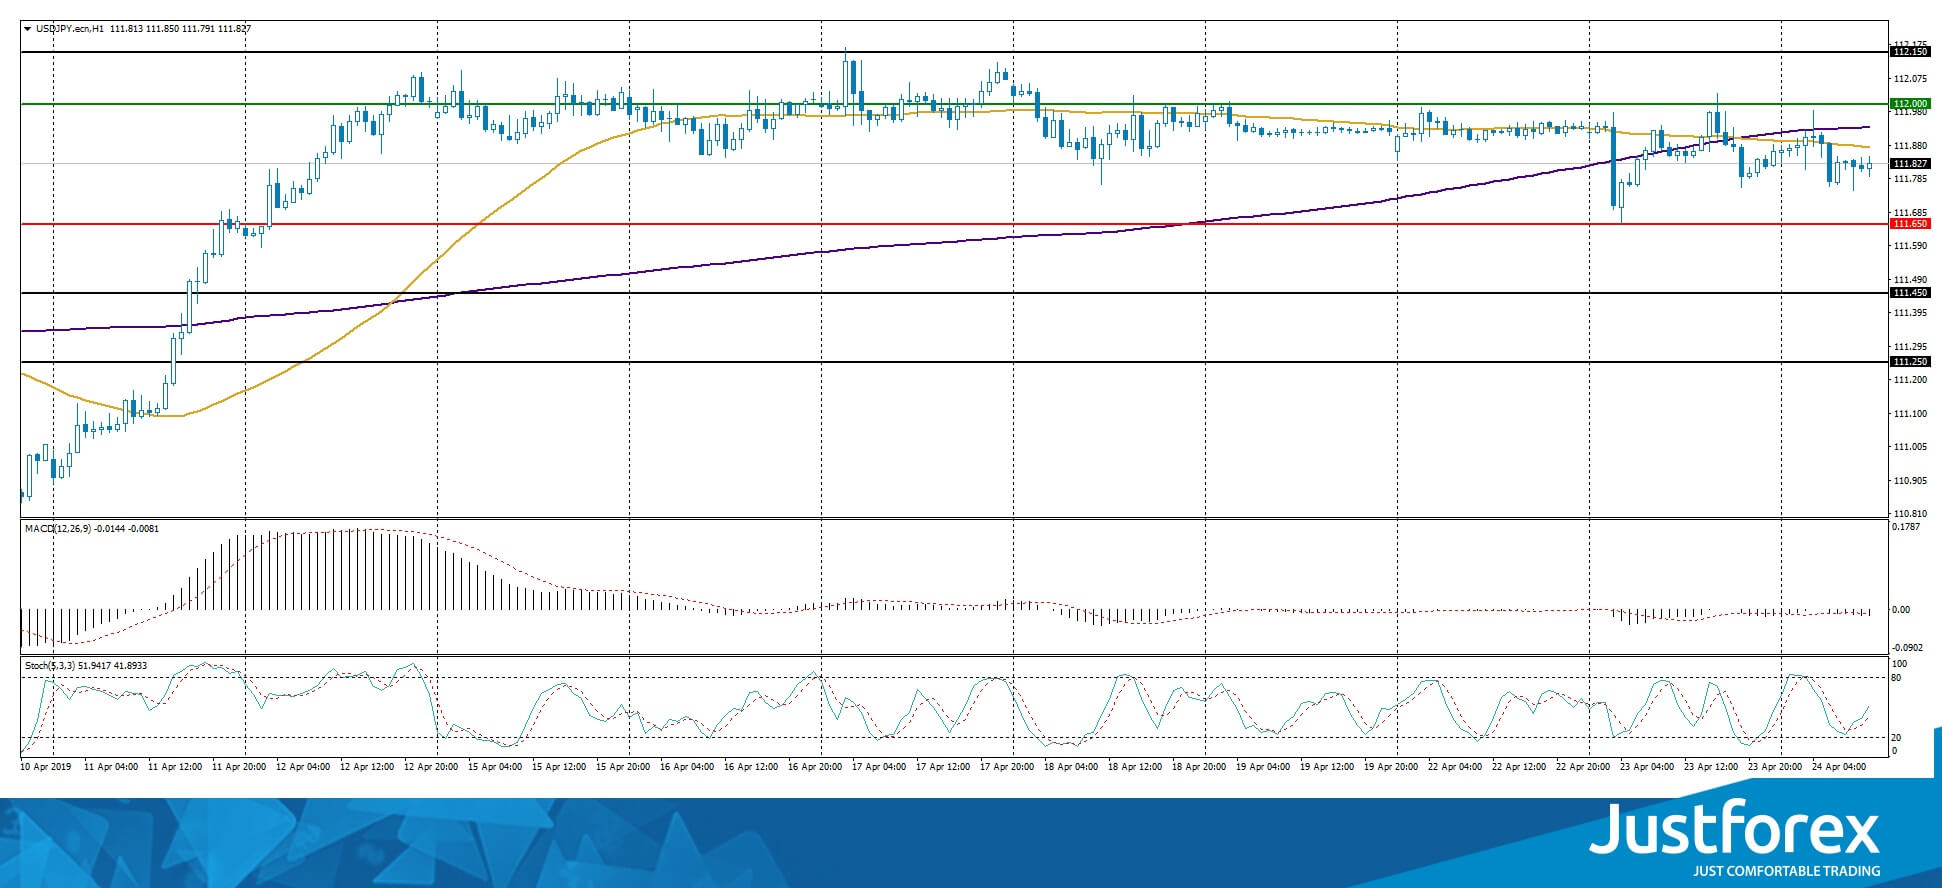
The indicators do not provide precise signals, 50 MA has crossed 200 MA.
The MACD histogram is in the negative zone which points toward a bearish mood.
The Stochastic Oscillator is in the neutral zone, the %K line is above the %D line which gives a signal to buy USD/JPY.
Trading recommendations
Support levels: 111.650, 111.450, 111.250
Resistance levels: 112.000, 112.150, 112.500
If the price fixes below 111.650, expect further descend toward 111.400-111.200.
Alternatively, the quotes can grow toward 112.300-112.500.


