EUR/USD
The American dollar closed the week lower against its major rivals, suffering a major setback after the release of softer-than-expected US employment data. The Nonfarm Payroll report showed that in May, the world’s largest economy added 138,000 new jobs, well below the 185K expected, while April reading was downwardly revised to 174K from previous estimate of 211K. The unemployment rate fell to 4.3%, the lowest in 16 years, but wages’ growth disappointed again, up 2.5% when compared to a year earlier. Euro’s rally was limited by poor PPI figures released early Friday. Inflation at factory levels remained flat in April, whilst the year-on-year reading came in at 4.3%, below the 4.5% expected, although above previous 3.9%. Still, the numbers came following a disappointing May preliminary inflation reading in the region, somehow denting hopes the ECB will have to retrieve QE sooner than planned. The Central Bank has its monetary policy meeting next Thursday, and speculative interest may remain cautious ahead of the event.
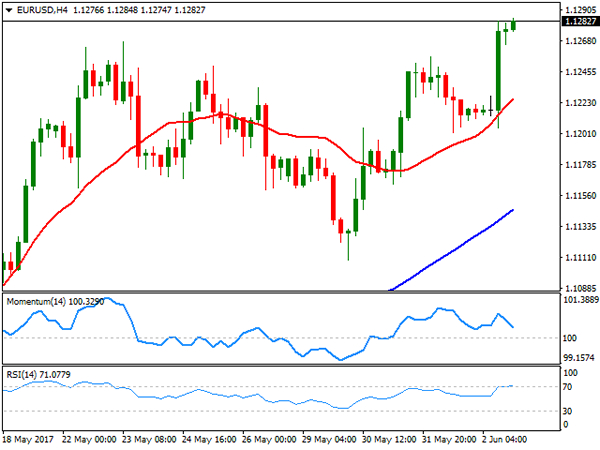
The EUR/USD pair remains biased towards the upside, trading at its highest for this 2017, and near the key 1.1300 figure, the high set last November following news that Donald Trump won the US election. In the daily chart, the RSI indicator has turned modestly higher near overbought levels,, while the Momentum remains flat above its 100 level, this last, reflecting the range bound trading seen last week. In the same chart, a strongly bullish 20 DMA leads the way higher, now providing support around 1.1130, while the longer ones stand well below this last. Shorter term, technical readings also lack directional momentum, but particularly the RSI indicator consolidates around 71, while a bullish 20 SMA contained the downside on Friday, now around 1.1220. Stops should be large above 1.1300, and if they get triggered, the pair has scope to advance up to the 1.1460 region this week, the level that pretty much capped rallies since January 2015.
Support levels: 1.1260 1.1220 1.1180
Resistance levels1.1300 1.1345 1.1390
USD/JPY
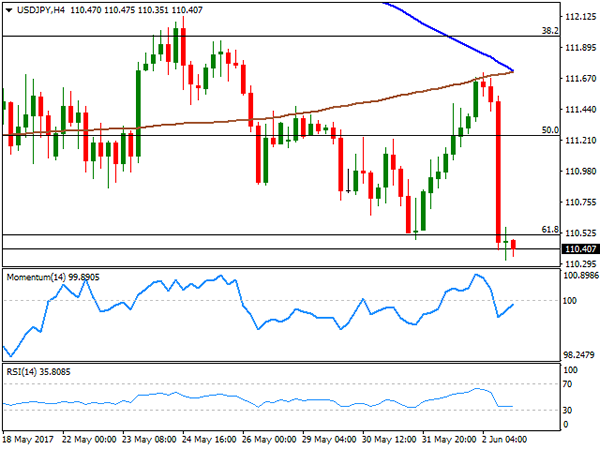
The USD/JPY pair closed the week at 110.40, barely above May’s low of 110.23 and a couple of pips below 110.50, the 61.8% retracement of its April/May rally between 108.12 and 114.36. The pair shed over 100 pips on Friday, following the release of a disappointing US employment report as the country created less jobs than expected, while wages remained subdued. Speculation that the US is close to full employment and therefore the sector will grow at a slower pace throughout 2017, dented further confidence in the greenback. Treasury yields plunged to fresh 2017 lows with the news, with the 10-year note yield ending the week at 2.16%, its lowest since last November. The 30-year note benchmark settled at 2.81% from previous 2.87%. From a technical point of view, the pair is poised to extend its decline, particularly on a break below the mentioned May low. In the daily chart, the price is developing below its 100 and 200 DMAs, while the RSI indicator accelerated its decline, now heading south around 39, also in line with a new leg lower. In the 4 hours chart, the 100 SMA accelerated its decline far above the current level, now converging with the 200 SMA around 111.70, while technical indicators have lost their downward strength, but remain within negative territory, also maintaining the risk towards the downside.
Support levels: 110.20 109.80 109.30
Resistance levels: 110.50 110.90 111.40
GBP/USD
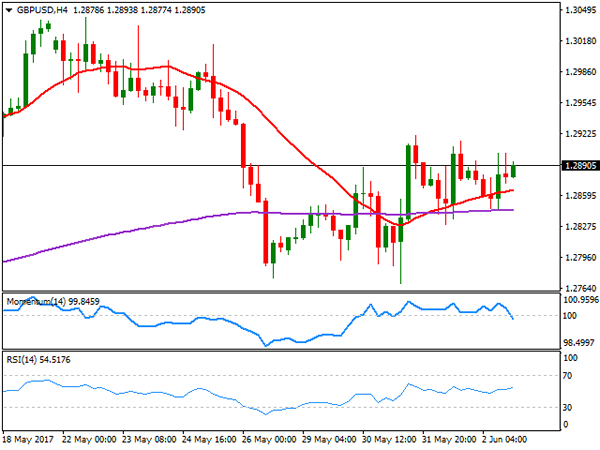
The GBP/USD pair managed to close the week marginally higher, but below the 1.2900 level, helped by a weaker greenback and despite undergoing political woes. Ahead of the General Election that will take place this Thursday, polls show that PM May’s Conservative party has been losing the lead, rising concerns over a possible hung Parliament. A poll released over the weekend, shows that Conservatives have the 40% of voters’ intention, while the Labour party advanced to get at this point 39%. Adding to political woes, the UK suffered another terror attack on Saturday that led to at least seven dead, although seems unlikely that May will delay the election. Headlines on election will likely dominate the pair ahead of the event, with wild spikes expected any side of the board and cautious recommended. Technically, the pair maintains a neutral stance, as in the daily chart, is holding right below a flat 20 DMA, providing resistance at 1.2920, while technical indicators head marginally lower around their mid-lines. In the 4 hours chart, the price has been holding above a horizontal 200 EMA at 1.2840, and now stands above a modestly bullish 20 SMA, but the Momentum indicator heads south around its 100 level whist the RSI stands at 54, diverging from each other, and therefore failing to provide clues on what’s next for the pair.
Support levels: 1.2840 1.2800 1.2760
Resistance levels: 1.2920 1.2960 1.3000
GOLD
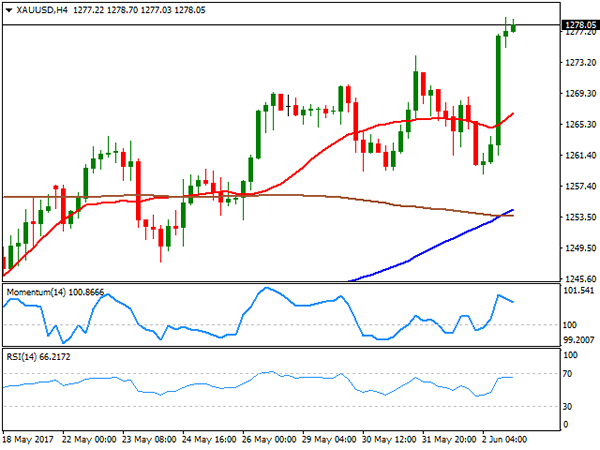
Gold prices rallied to fresh 6-week highs on Friday, with spot settling at $1,278.05 a troy ounce. The commodity rallied after US employment data disappointed, as doubts arose about Fed’s upcoming decisions on tightening. A June rate hike has been largely priced in, but has now become less of a certainty, while speculative interest is questioning if the US Central Bank will be able to maintain its tightening policy, particularly if data remain soft. Gold is bullish according to technical readings in the daily chart, as the price accelerated above a bullish 20 SMA that is advancing above the larger ones, whilst the RSI indicator turned north, now around 63, its highest since last April. In the 4 hours chat, the 100 SMA is crossing above the 200 SMA far below the current level, also below the 20 SMA, while technical indicators lost upward strength near overbought territory, but are far from suggesting an upcoming downward move.
Support levels: 1,274.05 1,265.90 1,254.60
Resistance levels: 1,283.10 1,295.40 1,307.15
WTI CRUDE OIL
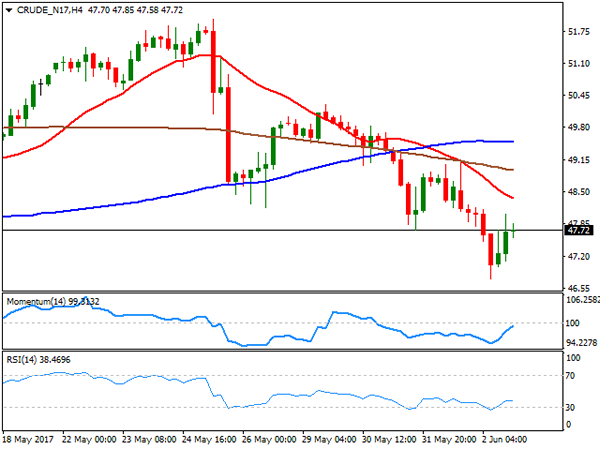
Crude oil prices edged lower for a second consecutive week, with West Texas Intermediate crude futures ending it at $47.42 a barrel, after printing 46.73 on Friday. The commodity remained under pressure after the EIA updated its International Petroleum statistics, upgrading its oil production forecast, while news that the US is leaving the Paris climate deal spurred concerns of further increase in US production. Additionally, the Baker Hughes report showed that the number of oil rigs increased to 733 from 722 in the previous week. Daily basis, the commodity has fallen steadily for the last five days and retains its bearish stance, with technical indicators heading south within negative territory and the price developing well below its moving averages. In the 4 hours chart, the 20 SMA gains bearish strength below the 100 and 200 SMAs, with the shortest offering a dynamic resistance around 48.60, while technical indicators have bounced from oversold territory, but lost upward strength within negative territory, maintaining the risk towards the downside.
Support levels: 47.20 46.65 44.85
Resistance levels: 48.60 49.30 49.90
DJIA
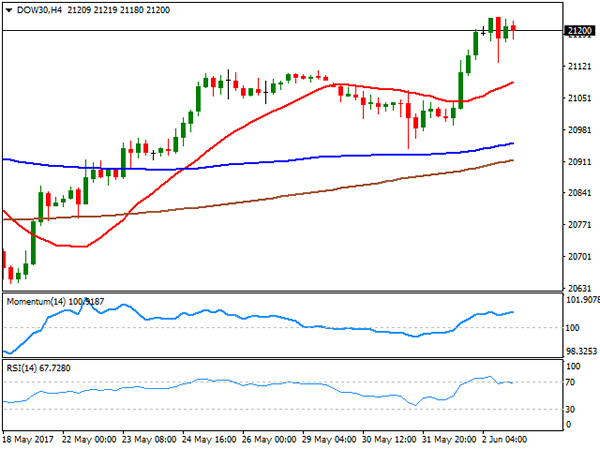
US equities managed to advance on Friday, with all of the three main indexes closing in the green and at record highs, despite soft local data. Not only the monthly employment report missed expectations, but also the trade balance deficit widened beyond expected in April, printing $-47.6B. The Dow Jones Industrial Average closed at 21,206.29, up by 62 points, whilst the Nasdaq Composite added 59 points or 0.94%, to 6,305.80. The S&P gained 9 points and closed at 2,439.07. Microsoft was the best performer within the Dow, adding 2.37%, followed by Boeing which gained 1.55%. Exxon Mobil and Chevron topped losers’ list amid falling oil prices, shedding 1.49% and 1.11% respectively. In the daily chart, the Momentum indicator heads sharply higher within positive territory, the RSI indicator consolidates around 66, whilst the index stands above its moving averages, all of which favors additional advances ahead. In the shorter term, and according to the 4 hours chart the upside is also favored, with indicators holding near overbought territory, while the 20 SMA accelerated its advance below the current level.
Support levels: 21,175 21,128 20,080
Resistance levels: 21,228 21,260 21,200
FTSE100
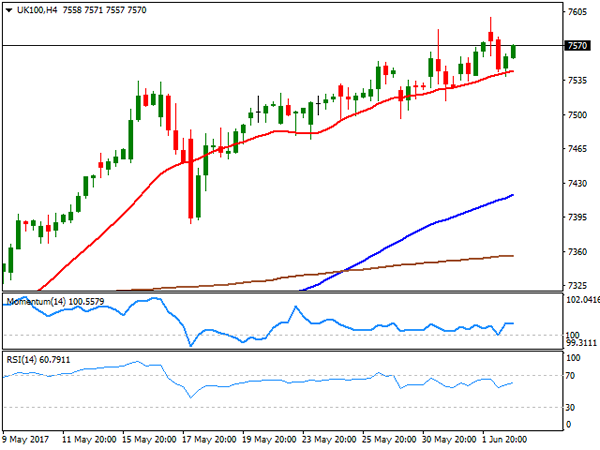
The FTSE 100 added 0.05% on Friday, closing the day at 7,547.63, pulling back, however, from fresh intraday record highs. Mining and financial-related equities contributed the most to the advance, with European markets following the strong lead of their Asian counterparts. Within the Footsie, Randgold Resources led gainers with a 4.01% gain, followed by Fresnillo that added 3.77%. Taylor Wimpey led decliners with a 2.74% loss, followed by Marks & Spencer that shed 2.03%. Technically, the daily chart shows that the Momentum indicator keeps retreating from overbought levels, but holding far above its mid-line, while the RSI indicator hovers around 71 as the index remains far above moving averages, maintaining the risk towards the upside. In the 4 hours chart, the technical picture is neutral-to-bullish as the index keeps developing above a bullish 20 SMA, while technical indicators hold within positive territory, although with no directional strength.
Support levels: 7,550 7,515 7,490
Resistance levels: 7,588 7,620 7,660
DAX
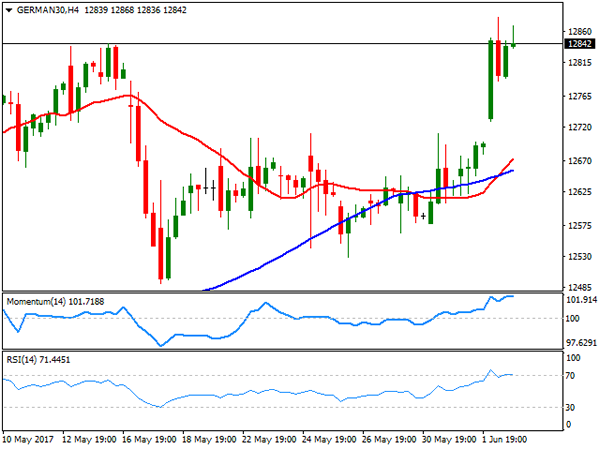
European equities closed higher on Friday, with the German DAX adding 160 points or 1.25%, to settle at 12,822.94, a record high, boosted by strong gains in the automotive and pharmaceutical sectors. Siemens was the best performer with a 2.12% gain, followed by Bayer that added 1.2%. Only three components closed lower, including Deutsche Bank and Commerzbank, down 0.48% and 0.27% respectively. The market ignored the soft producer price index in the region, as latest local data maintained optimism high among local investors. The index is bullish daily basis, having accelerated above a bullish 20 SMA, also far above the larger ones, whilst technical indicators have entered positive territory with a strong upward momentum. In the 4 hours chart, technical indicators have partially lost upward strength near overbought levels, but are far from anticipating a downward move, whilst the index stands far above its moving averages, in line with the longer term outlook.
Support levels: 12,788 12,729 12,657
Resistance levels: 12,881 12,930 12,975