
The EUR/USD currency pair
Technical indicators of the currency pair:
Prev Open: 1.11970
Open: 1.11713
% chg. over the last day: -0.19
Day’s range: 1.11583 – 1.11775
52 wk range: 1.1111 – 1.2009
Demand for USD remains high. The EUR/USD quotes updated the local minimums. Jerome Powell mentioned earlier that the regulator will keep the current monetary policy. This statement disproven the previous idea that the Central Bank is willing to review the lowering of the key interest rates. USD is additionally supported by the growth of the US Treasury obligations. The quotes are currently consolidating around 1.11600-1.11850. The investors are waiting for he US labour report
The Economic News Feed for 03.05.2019:
Consumer Price Index (EU) – 12:00 (GMT+3:00);
Labour Market Report (EU) – 15:30 (GMT+3:00);
Business Activity in the US non-Industrial Sector (EU) – 17:00 (GMT+3:00);
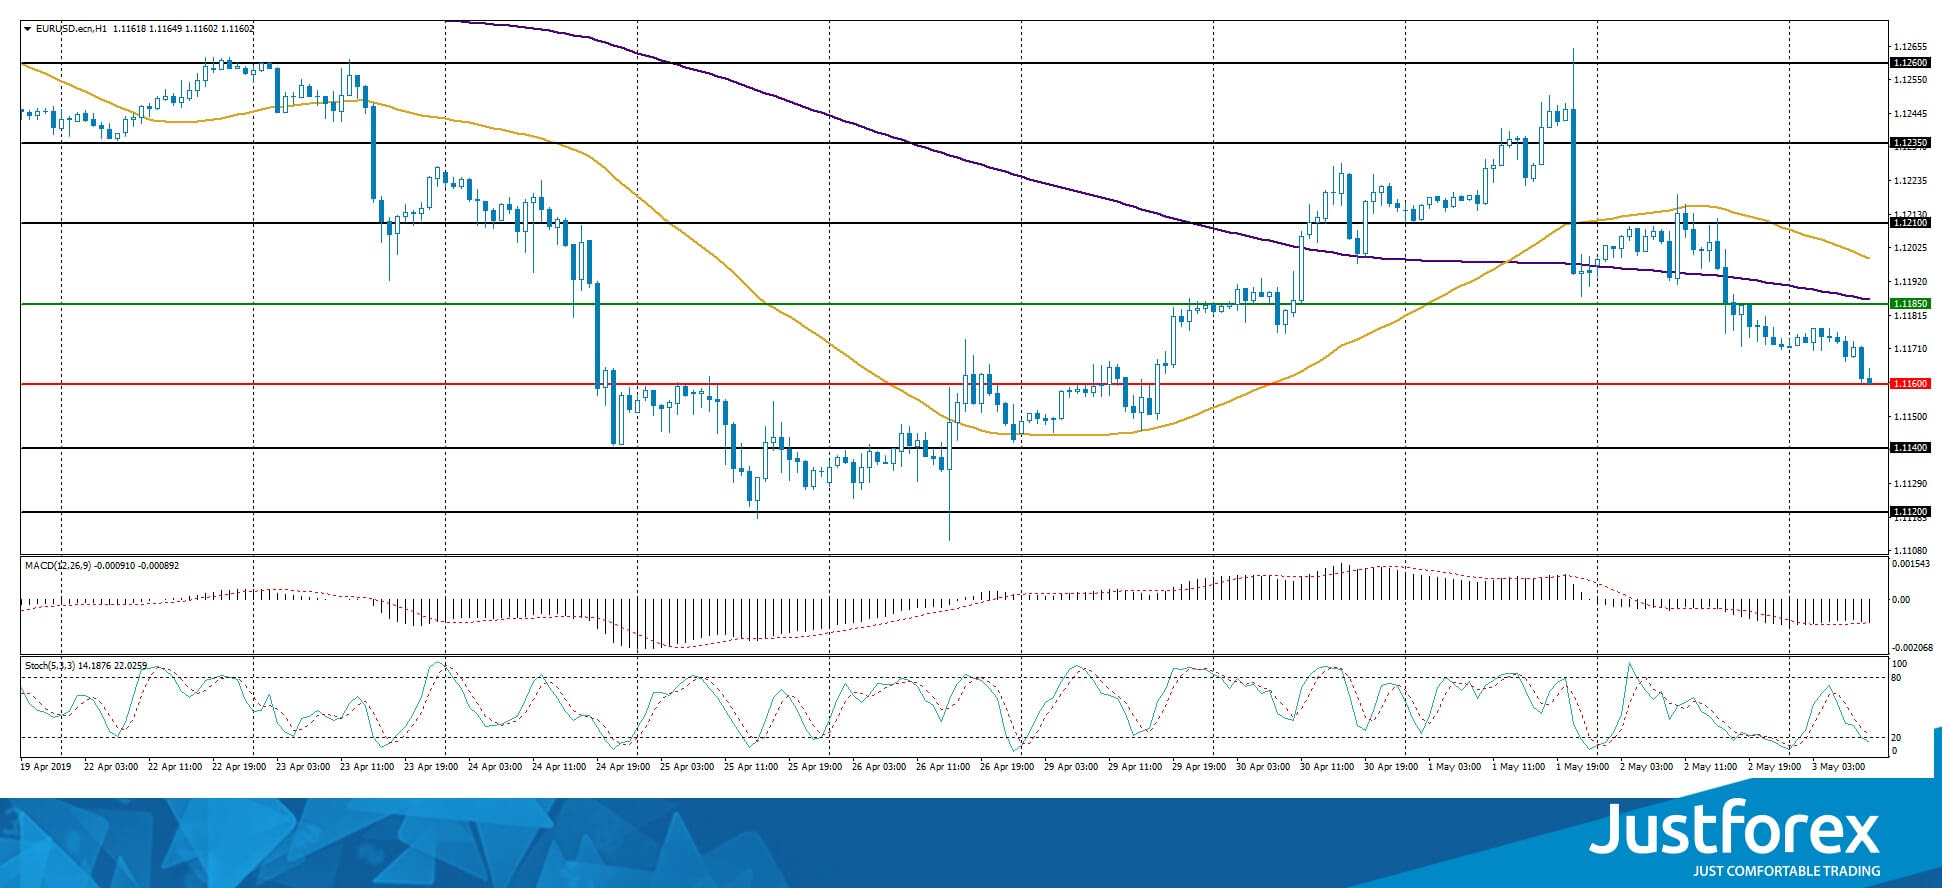
The price fixed below 50 MA and 200 MA which points to the power of the buyers.
The MACD histogram is in the negative zone and keeps falling which gives a strong signal to sell EUR/USD.
The Stochastic Oscillator is in the neutral zone, the %K line is below the %D line which points to the bearish mood.
Trading recommendations
Support levels: 1.11600, 1.11400, 1.11200
Resistance levels: 1.11850, 1.12100, 1.12350
If the price fixes below 1.11600, expect further fescend toward 1.11200-1.11000.
Alternatively, the quotes can grow toward 1.12000-1.12300.
The GBP/USD currency pair
Technical indicators of the currency pair:
Prev Open: 1.30518
Open: 1.30276
% chg. over the last day: -0.13
Day’s range: 1.30152 – 1.30438
52 wk range: 1.2438 – 1.3631
GBP/USD started to descend after a long rally. The demand for USD has significantly grown. The Bank of England, as expected, kept the key monetary policy parameters at the same level. Right now GBP is consolidating. The key support and resistance levels are 1.30100 and 1.30450. The trading instrument can correct further. Keep an eye on the US labour report for April. You should open positions from the key levels.
At 11:30 the UK has published a business activity index in the Service industry.
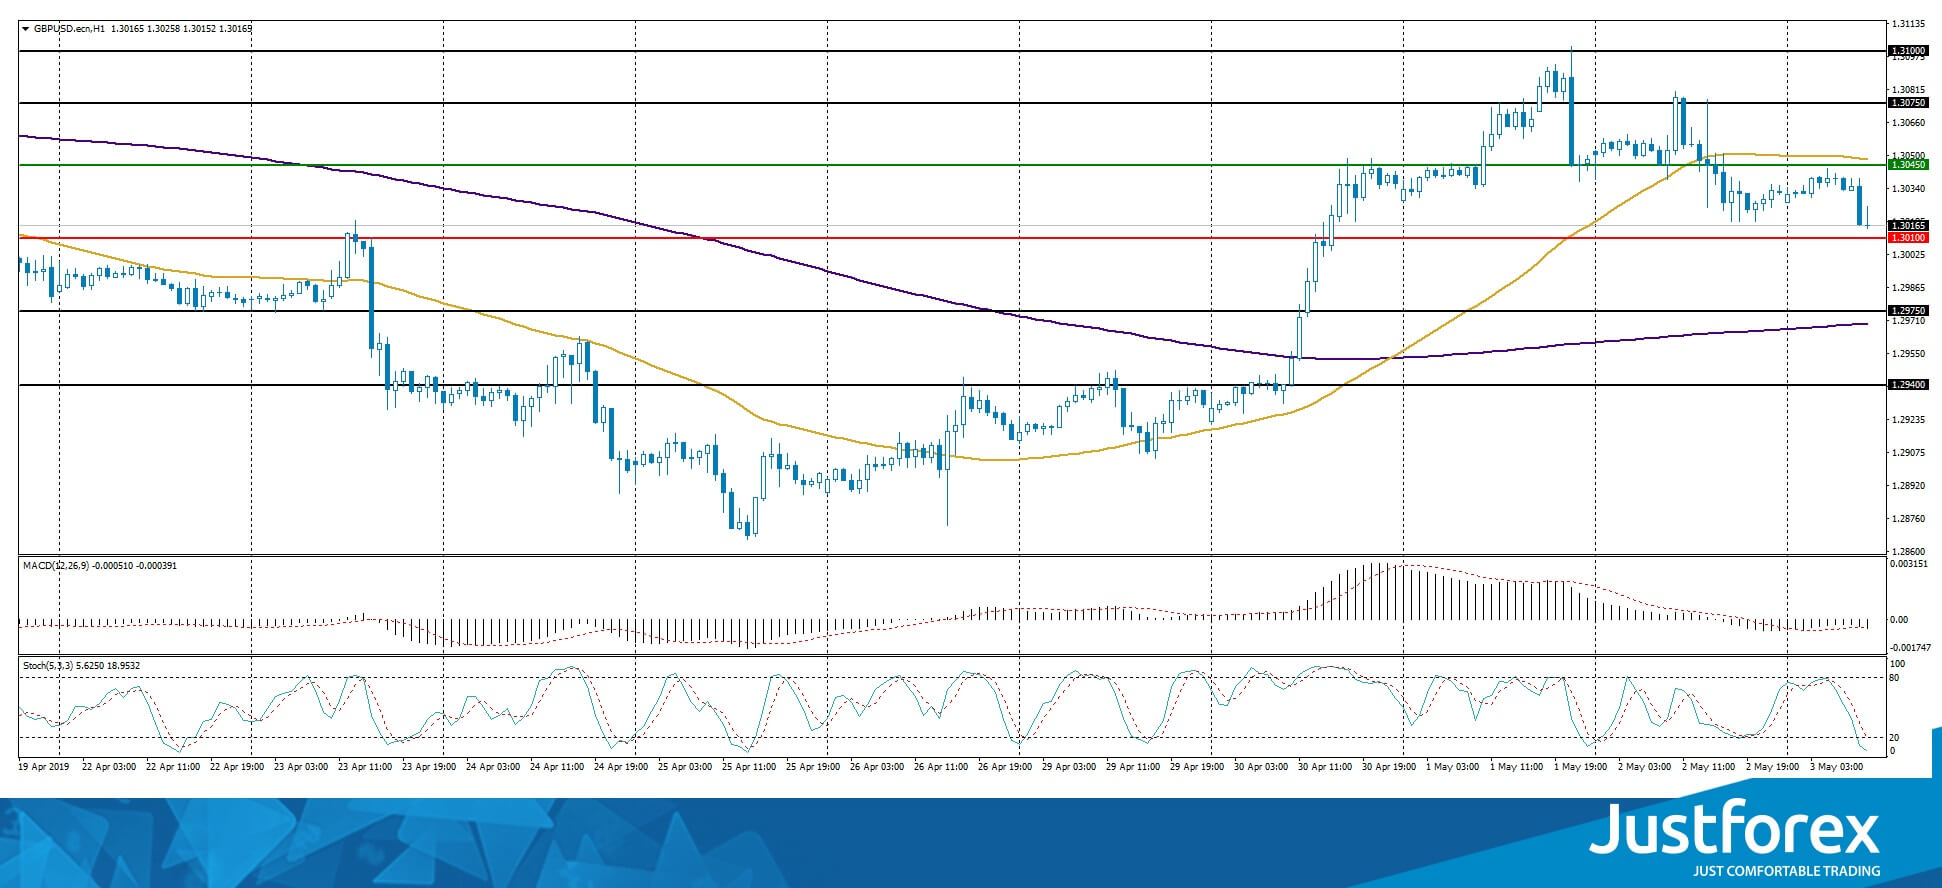
The indicators do not provide precise signals, the price fixed between 50 MA and 200 MA.
The MACD histogram is in the negative zone and keeps falling which gives a strong signal to sell GBP/USD.
The Stochastic Oscillator is near the oversold zone, the %K line is below the %D line which also points to a bearish mood.
Trading recommendations
Support levels: 1.30100, 1.29750, 1.29400
Resistance levels: 1.30450, 1.30750, 1.31000
If the price fixes below 1.30100, expect further descend toward 1.29750-1.29500.
Alternatively, the quotes can grow toward 1.30700-1.31000.
The USD/CAD currency pair
Technical indicators of the currency pair:
Prev Open: 1.34303
Open: 1.34657
% chg. over the last day: +0.20
Day’s range: 1.34629 – 1.34740
52 wk range: 1.2727 – 1.3664
The USD/CAD technical picture is ambiguous. CAD is consolidating around 1.34450-1.34750. An additional pressure is caused by agressive sales on the oil market. The US trading report for April is in the spotlight. You should open positions from the key levels.
The Economic News Feed for 03.05.2019 is calm.
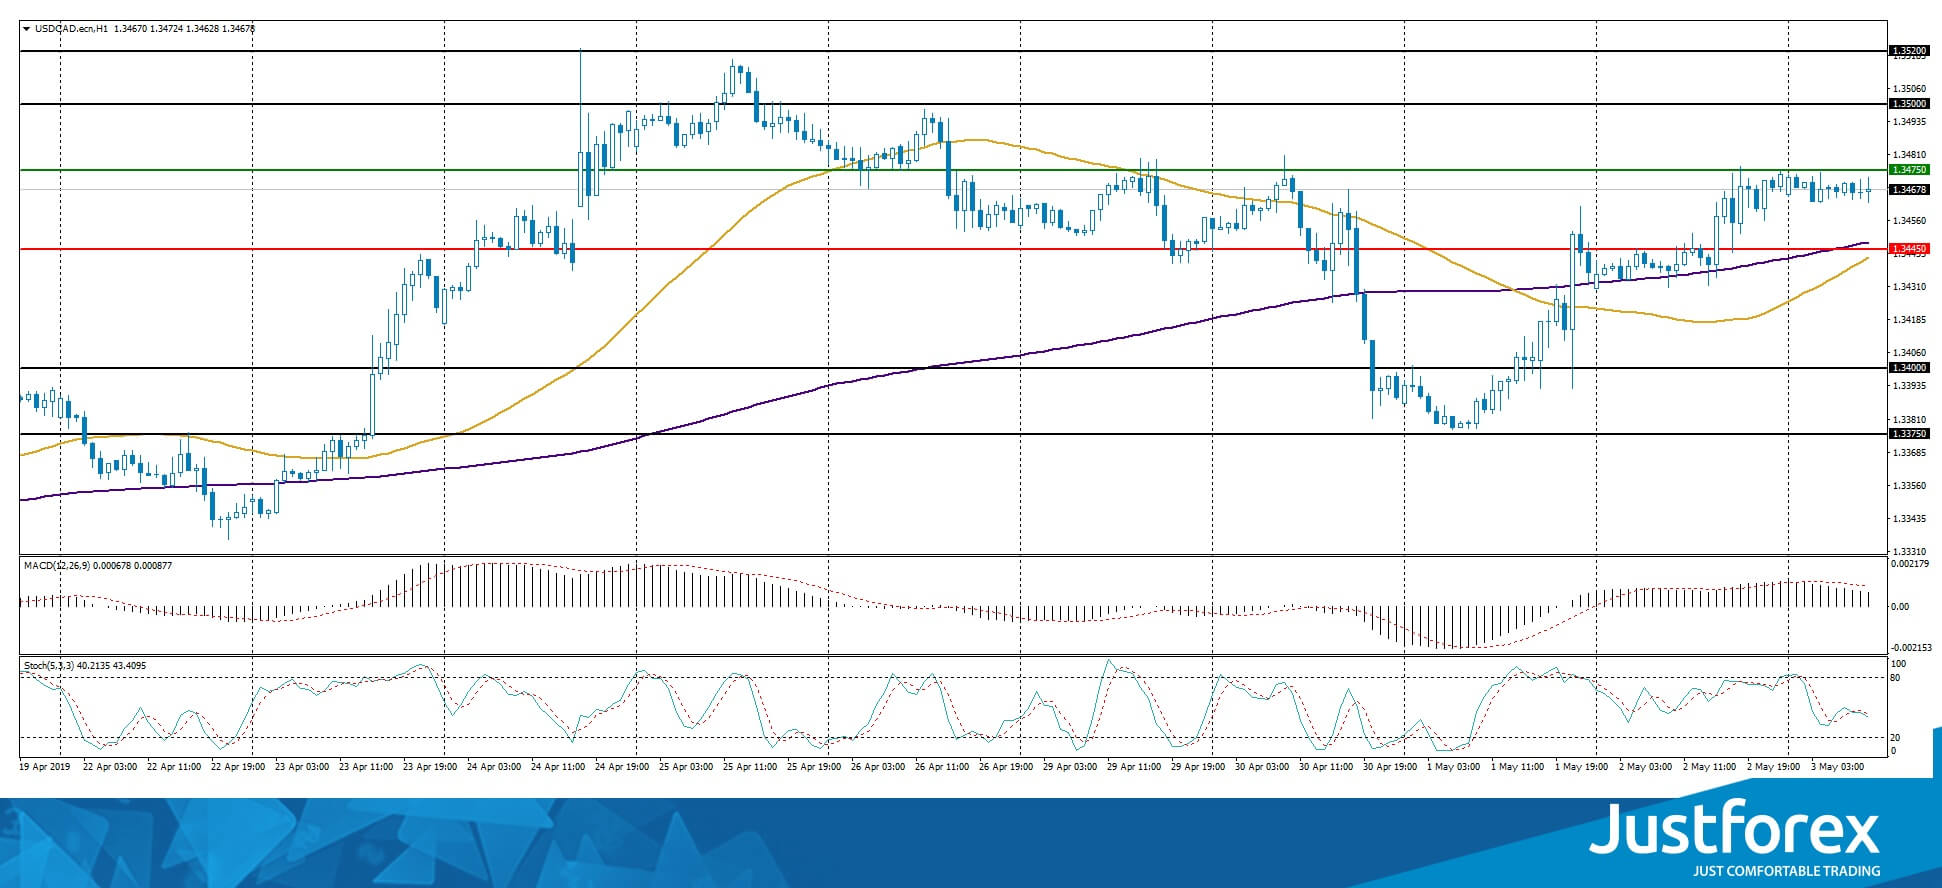
The indicators do not provide precise signals: 50 MA started to cross 200 MA.
The MACD histogram is in the positive zone but below the signal line which gives a weak signal to buy USD/CAD.
The Stochastic Oscillator is in the neutral zone, the %K line is crossing the %D line. There are no signals at the moment.
Trading recommendations
Support levels: 1.34450, 1.34000, 1.33750
Resistance levels: 1.34750, 1.35000, 1.35200
If the price fixes above 1.34750, consider selling USD/CAD. The price will move toward 1.35200-1.35500.
Alternatively, the quotes can fall toward 1.34200-1.34000.
The USD/JPY currency pair
Technical indicators of the currency pair:
Prev Open: 111.380
Open: 111.488
% chg. over the last day: +0.09
Day’s range: 111.407 – 111.542
52 wk range: 104.97 – 114.56
USD/JPY keeps consolidating. There is no defined trend. The trading instrument is testing the local support and resistance levels at 111.400 and 111.650. The market participants are waiting for additional drivers. Keep an eye on the US Treasury bonds’ yield. You should open positions from the key levels.
The Japanese markets are closed due to holidays.
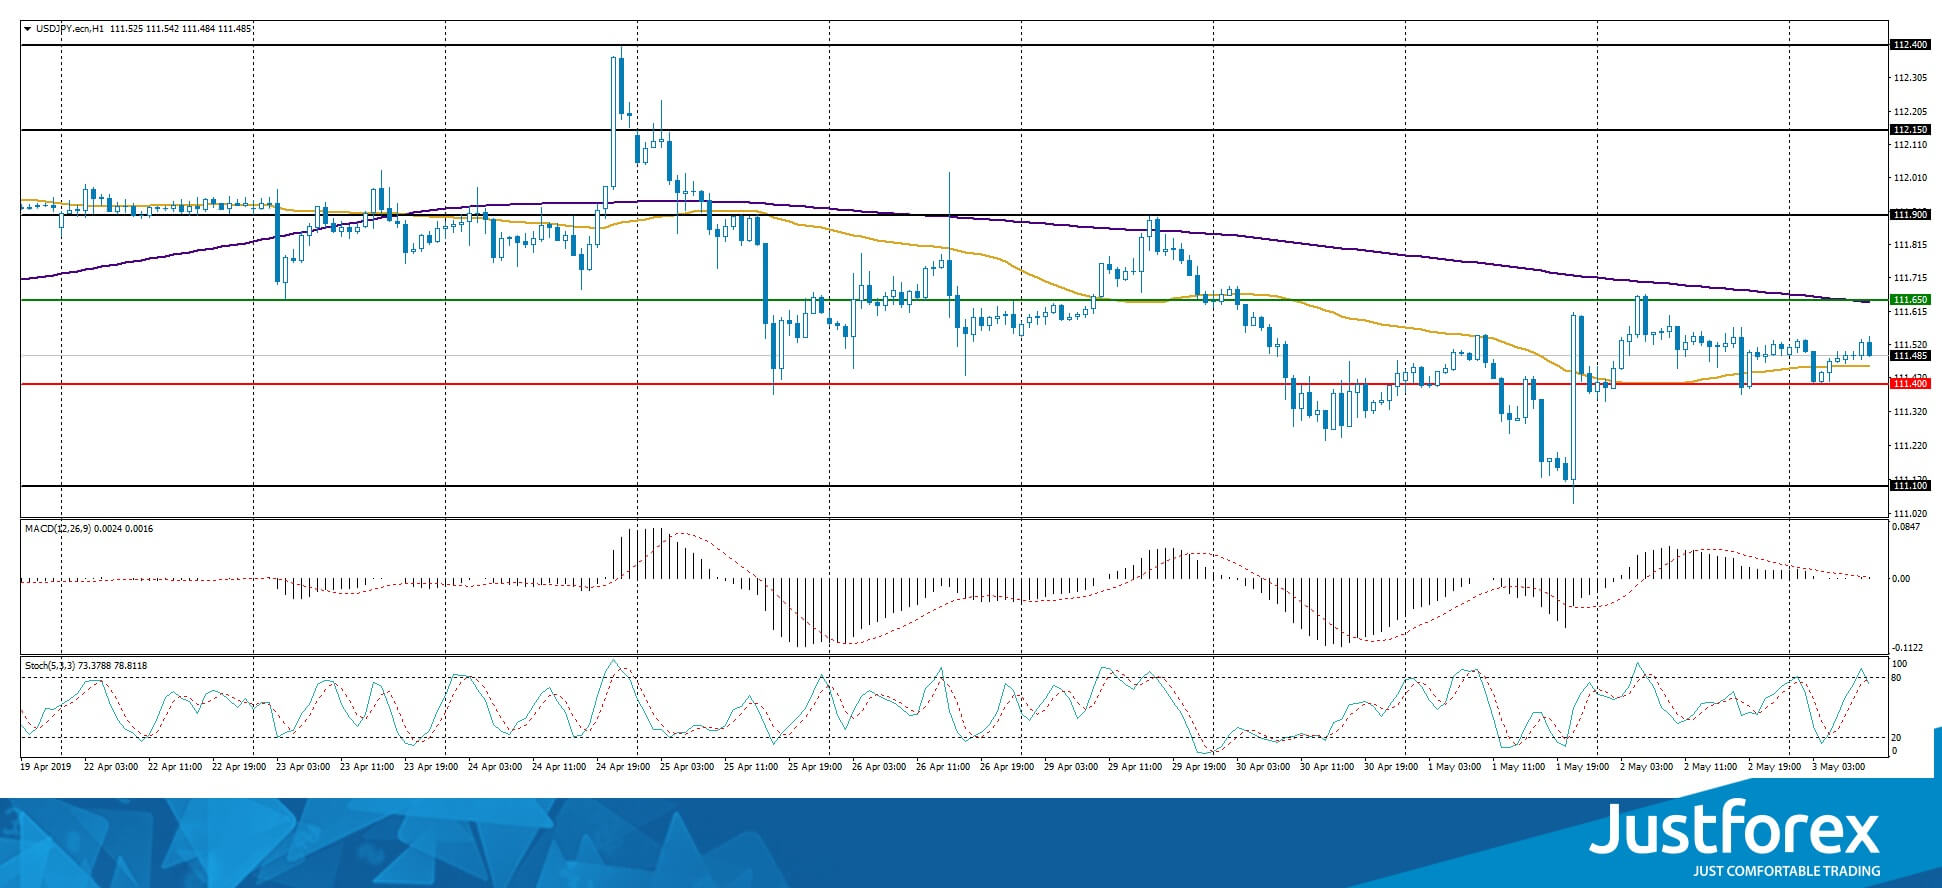
The indicators do not provide precise signals: the price fixed between 50 MA and 200 MA
The MACD histogram is close to 0.
The Stochastic Oscillator is in the neutral zone, the %K line is crossing the %D line. There are no signals at the moment.
Trading recommendations
Support levels: 111.400, 111.100
Resistance levels: 111.650, 111.900, 112.150
If the price fixes below 111.400, expect further descend toward 111.000.
Alternatively, the quotes can grow toward 111.900-112.150.


