
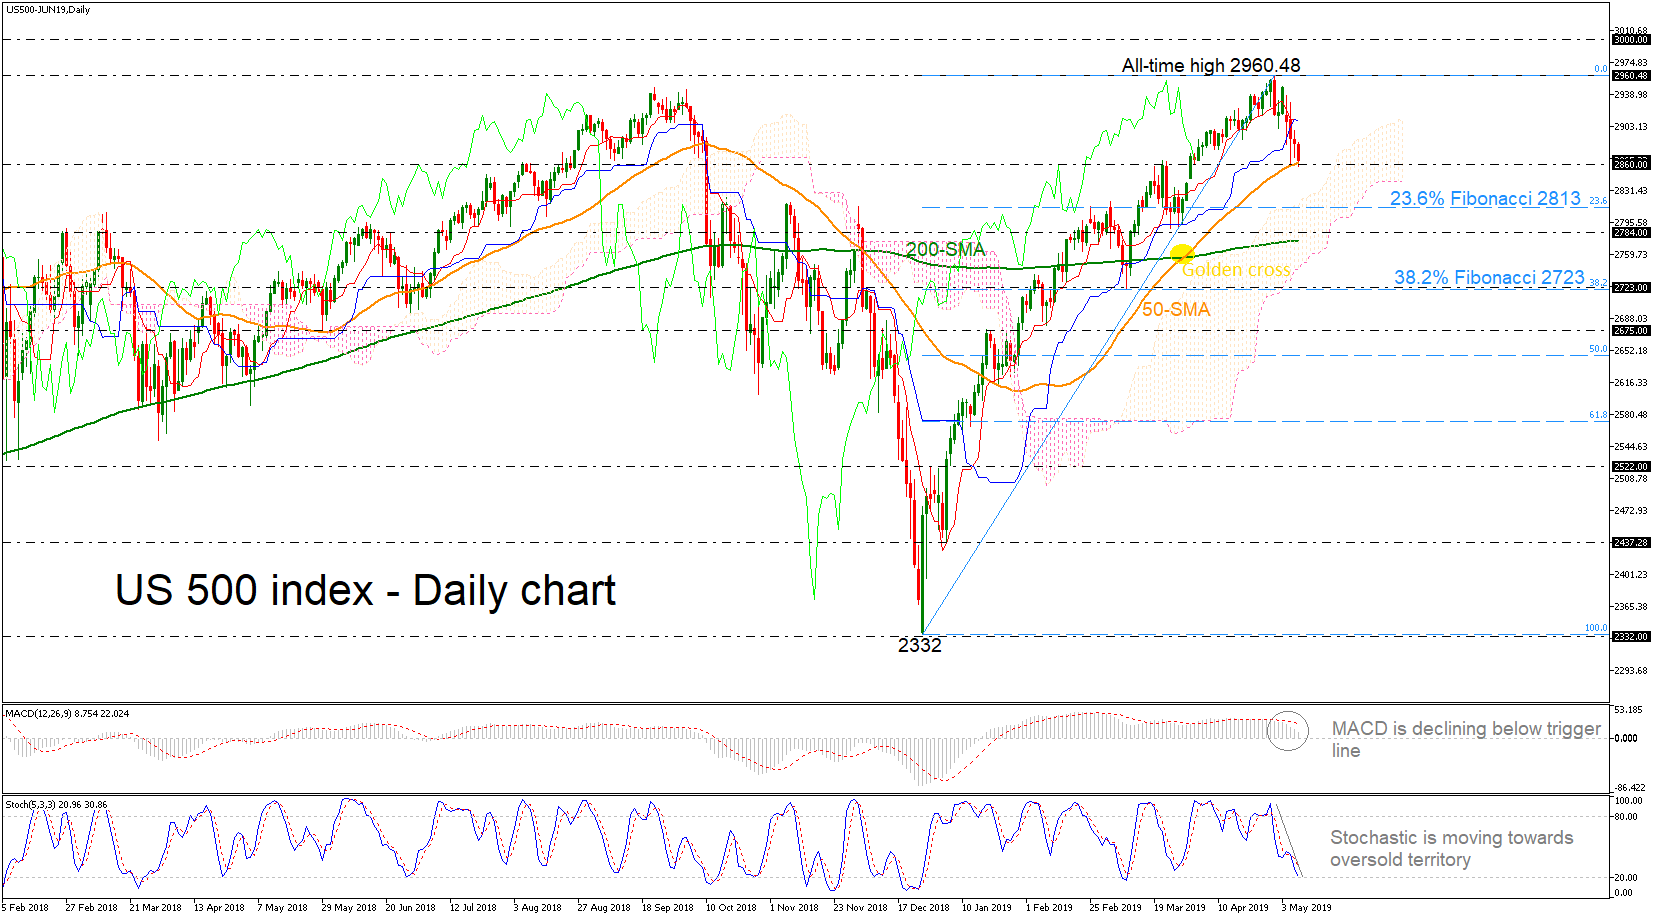
The US 30 stock index has declined over the last three consecutive days after it reached another all-time high of 2960.48. Currently, the price is meeting the 2860 support area, which overlaps with the 50-day simple moving average in the daily timeframe, slipping beneath the red Tenkan-sen and the blue Kijun-sen lines. The bearish correction picture in the medium term is further supported by the MACD, which is falling below its red signal line and the stochastic oscillator is moving towards the oversold territory.
Should prices move lower, support could come at the 23.6% Fibonacci retracement level of the upleg from 2332 to 2960.48 around 2813. Below that, the 2784 is another major support before touching the 200-day SMA near 2775.
To the upside, resistance is coming from the all-time high of 2960.48, while above that, the next major obstacle to watch is the 3000 handle.
Summarizing, in the near-term, the momentum indicators point to a possible bearish retracement, however, the index is still creating higher highs and higher lows over the last four months, which augurs well for the medium-term.


