
Key Highlights
- The US Dollar declined sharply after it was rejected above 112.00 against the Japanese Yen.
- USD/JPY traded below a crucial bullish trend line with support at 111.05 on the daily chart.
- The US PPI in April 2019 increased 2.2% (YoY), less than the +2.3% forecast.
- The US CPI in April 2019 could rise 2.1% (YoY), up from than the last +1.9%.
USDJPY Technical Analysis
This past month, the US Dollar climbed above the key 112.00 resistance against the Japanese Yen. The USD/JPY pair failed to hold gains above 112.00, topped at 112.39, and recently declined below 110.00.
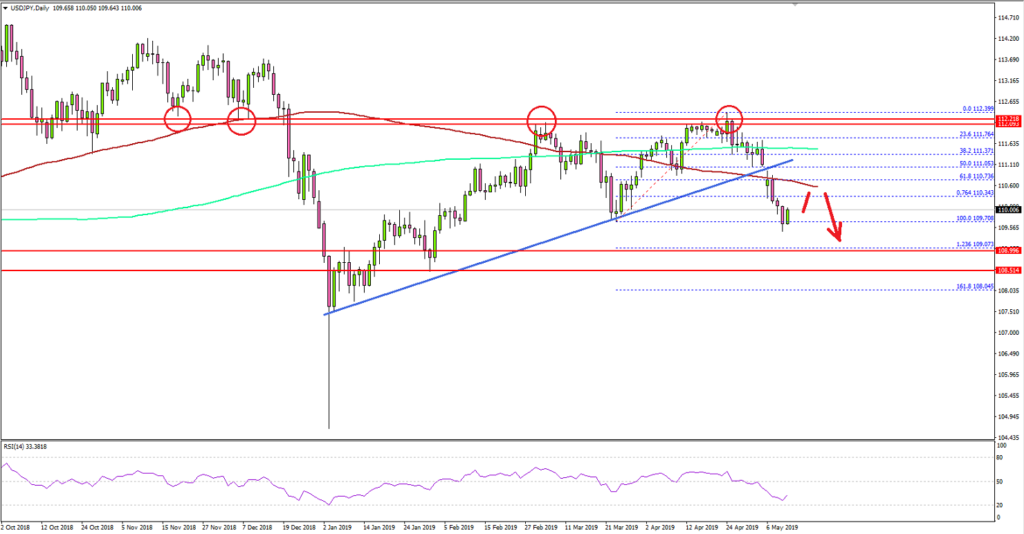
Looking at the daily chart, the pair started a major decline after it was rejected above 112.00 and 112.20. It traded below many supports such as 111.80, 111.50 and 111.00.
During the drop, there was a break below a crucial bullish trend line with support at 111.05. The pair even broke 110.80, the 100-day simple moving average (red), and the 200-day simple moving average (green).
Recently, the pair traded below the 76.4% Fib retracement level of the upward move from the 109.70 swing to 112.39 high. It opened the doors for more losses and the pair spiked below the 109.70 low.
It seems like the pair moved into a strong downtrend below 110.80 and the 100-day SMA. Therefore, there is a risk of further downsides towards the 109.00 level or the 1.236 Fib extension level of the upward move from the 109.70 swing to 112.39 high.
On the upside, the previous supports near 110.80, 100-day SMA, and the 111.00 pivot level are likely to prevent gains if the pair starts a rebound in the near term.
Fundamentally, the US Producer Price Index for April 2019 was released by the Bureau of Labor statistics, Department of Labor. The market was looking for a 2.3% rise in the PPI, compared with the same month a year ago.
However, the actual result was below the forecast, as the UP PPI increased 2.2%, similar to the last reading. Looking at the monthly change, it came in at 0.2%, similar to the forecast, but down from the last 0.6%.
The report added:
The index for final demand less foods, energy, and trade services moved up 0.4 percent in April, the largest increase since rising 0.5 percent in January 2018. For the 12 months ended in April, prices for final demand less foods, energy, and trade services advanced 2.2 percent.
Overall, GBP/USD declined recently below 1.3050, EUR/USD remained below the key 1.1250 resistance, and USD/JPY remains at a risk of more downsides in the coming days.
Economic Releases to Watch Today
- UK Industrial Production for March 2019 (MoM) – Forecast +0.1%, versus +0.6% previous.
- UK Manufacturing Production for March 2019 (MoM) – Forecast +0.2%, versus +0.9% previous.
- UK GDP for Q1 2019 (Preliminary) (QoQ) – Forecast +0.5%, versus +0.2% previous.
- US Consumer Price Index April 2019 (MoM) – Forecast +0.4%, versus +0.4% previous.
- US Consumer Price Index April 2019 (YoY) – Forecast +2.1%, versus +1.9% previous.
- US Consumer Price Index Ex Food & Energy April 2019 (YoY) – Forecast +2.1%, versus +2.0% previous.
- Canada’s Net Employment Change April 2019 – Forecast 10K, versus -7.2K previous.
- Canada’s Unemployment Rate April 2019 – Forecast 5.8%, versus 5.8% previous.


