
The EUR/USD currency pair
Technical indicators of the currency pair:
Prev Open: 1.12031
Open: 1.12017
% chg. over the last day: -0.04
Day’s range: 1.12015 – 1.12110
52 wk range: 1.1111 – 1.2009
EUR/USD is moving sideways, the technical picture is ambiguous. The support and resistance are at 1.12000 and 1.12200. EUR is supported by the statements that the US may not introduce fees on the import cars in the next six months. The market participants are waiting for important releases from the US. Keep in mind that the real data may differ from the forecasted.
The Economic News Feed for 16.05.2019:
Real Estate Market Stats (US) – 15:30 (GMT+3:00);
PMI from Philadelphia’s Federal Reserve (EU) – 15:30 (GMT+3:00);
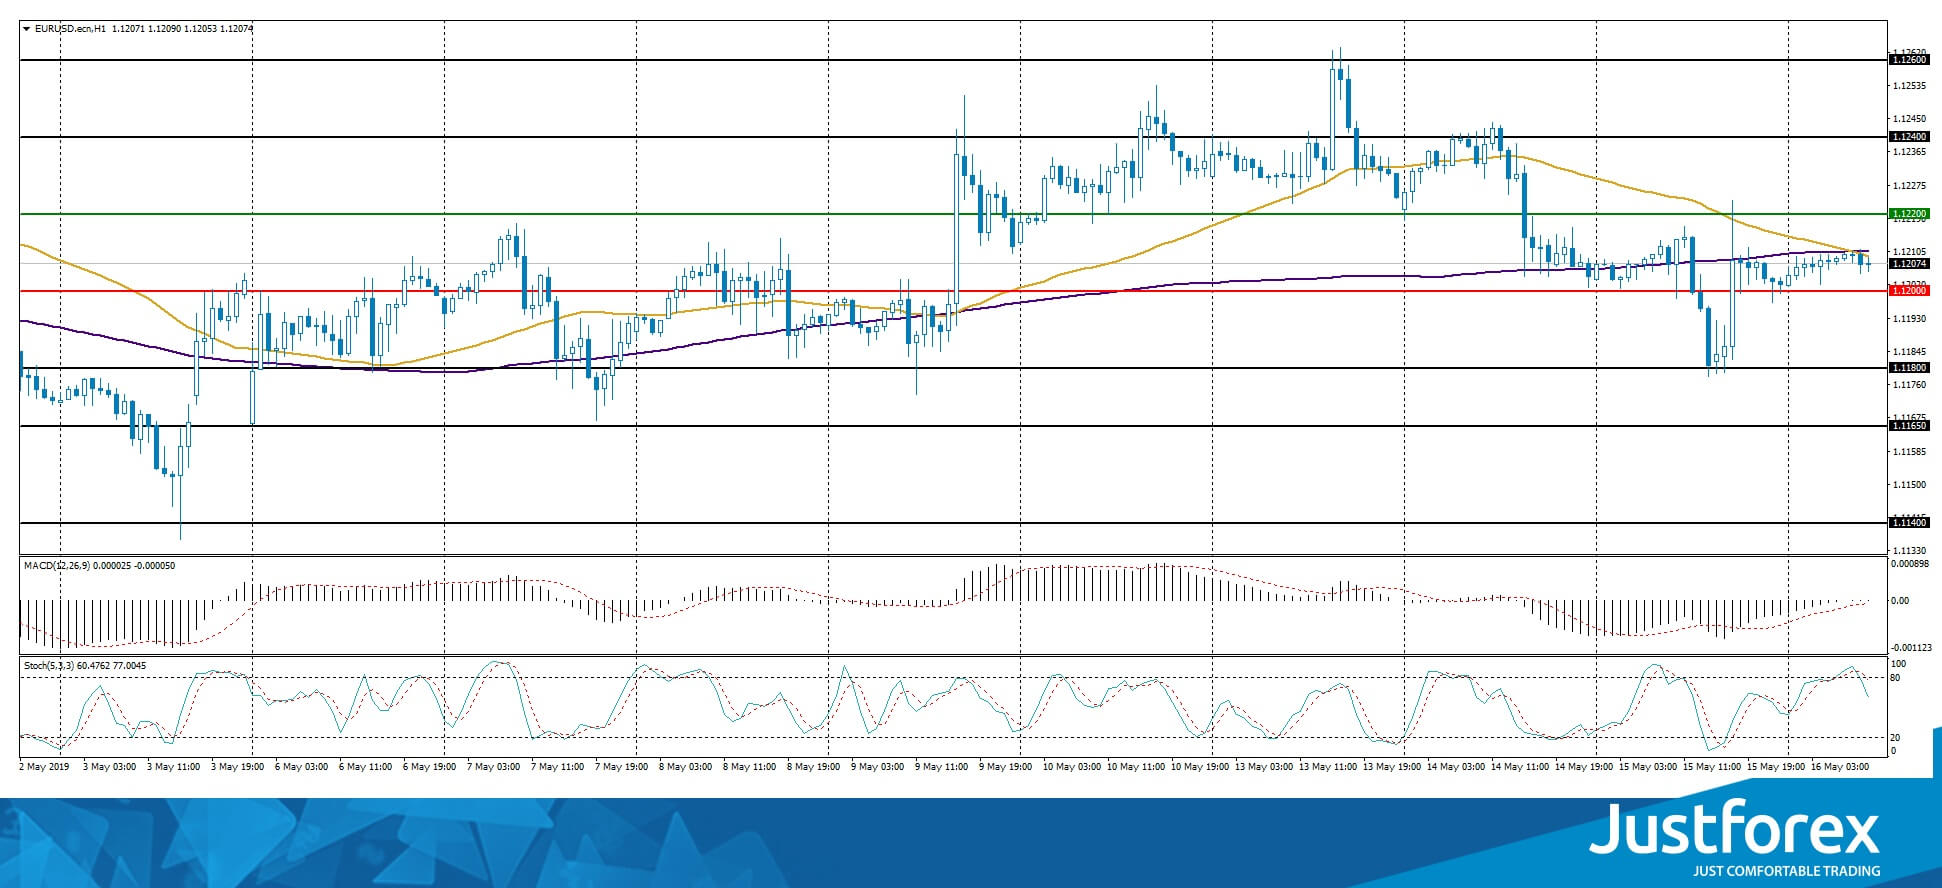
The indicators do not provide precise signals, 50 MA has crossed 200 MA.
The MACD histogram is close to 0.
The Stochastic Oscillator is in the oversold zone, the %K line is below the %D line which points to the bearish mood.
Trading recommendations
Support levels: 1.12000, 1.11800, 1.11650
Resistance levels: 1.12200, 1.12400, 1.12600
If the price fixes below 1.12000, expect further descend toward 1.11800-1.11600.
Alternatively, the quotes can recover toward 1.12400-1.12600.
The GBP/USD currency pair
Technical indicators of the currency pair:
Prev Open: 1.29035
Open: 1.28413
% chg. over the last day: -0.47
Day’s range: 1.28209 – 1.28518
52 wk range: 1.2438 – 1.3631
GBP/USD keeps showing a negative trend. Yesterday GBP reached the 3-monthly minimum regarding the USD. GBP is under pressure due to the growing expectations of failure to reach any consensus between Theresa May and the opposing parties. The quotes are testing the 1.28250-1.28800 range. The trading instrument has prospects for further descend. Keep an eye on the US news feed.
The Economic News Feed for 16.05.2019 is calm.
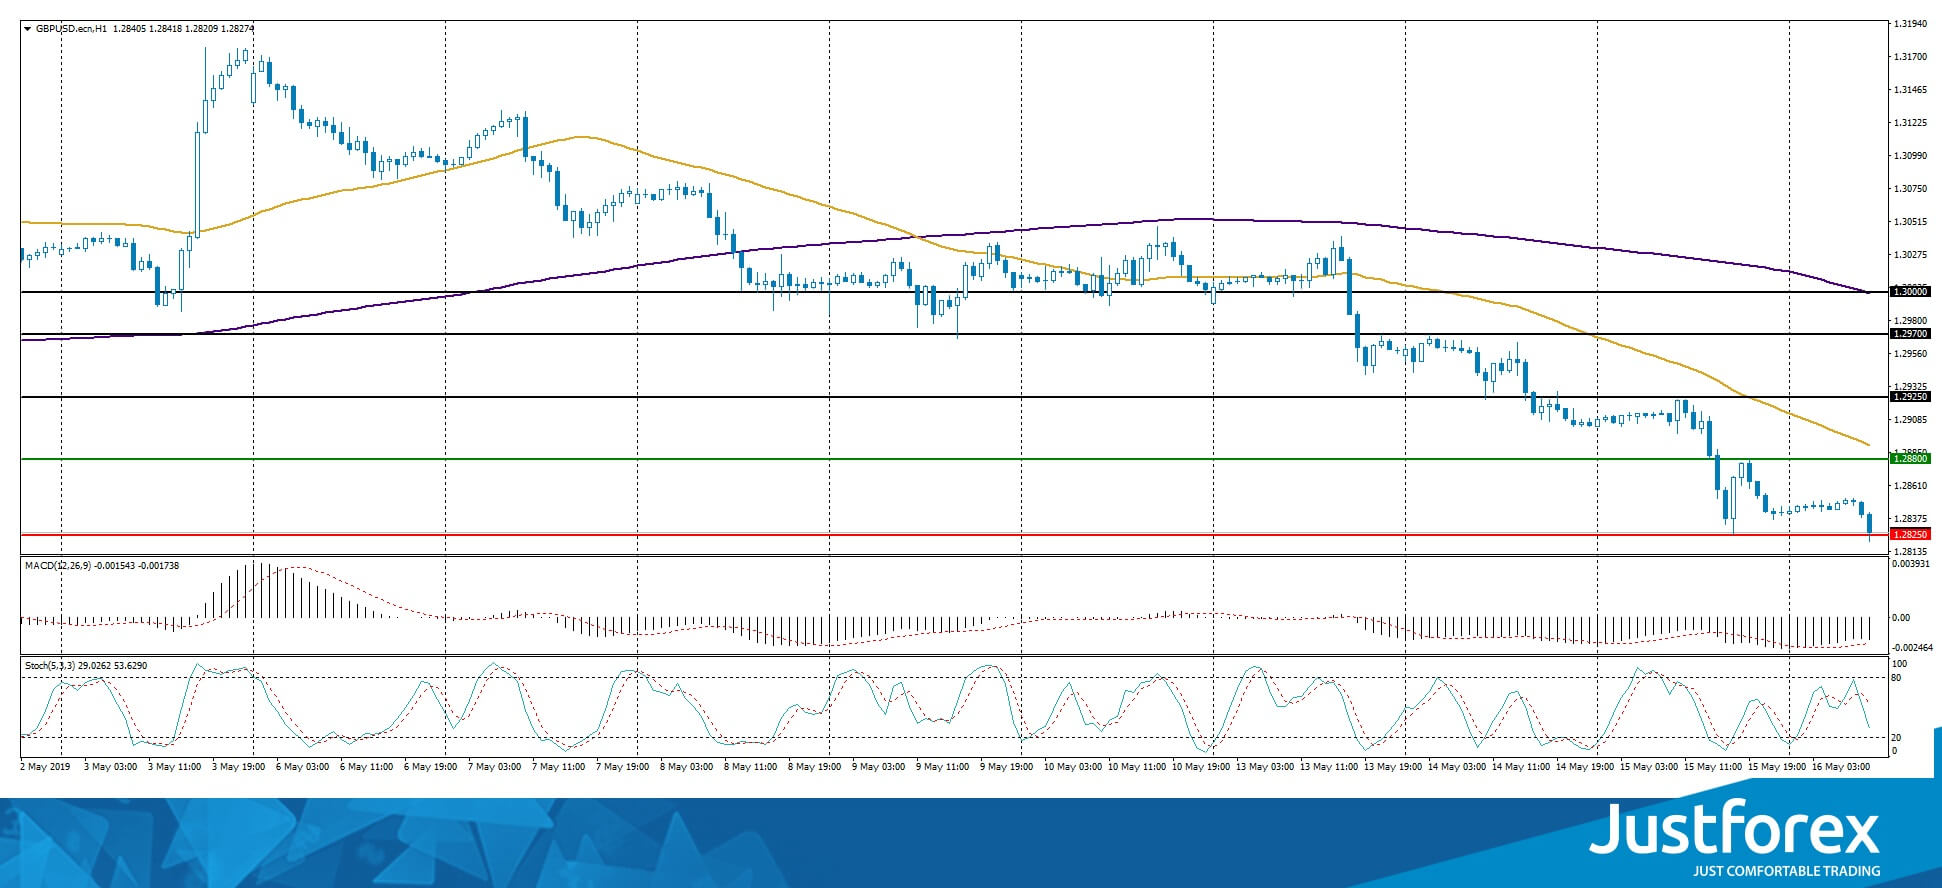
The price fixed below 50 MA and 200 MA which points to the power of the sellers.
The MACD histogram is in the negative zone but above the signal line which gives a weak signal to sell GBP/USD.
The Stochastic Oscillator is in the neutral zone, the %K line is below the %D line which points to the bearish mood.
Trading recommendations
Support levels: 1.28250, 1.27600
Resistance levels: 1.28800, 1.29250, 1.29700
If the price fixes below 1.28250, expect further descend toward 1.27600-1.27400.
Alternatively, the quotes can recover toward the round 1.29000.
The USD/CAD currency pair
Technical indicators of the currency pair:
Prev Open: 1.34629
Open: 1.34369
% chg. over the last day: -0.14
Day’s range: 1.34266 – 1.34504
52 wk range: 1.2727 – 1.3664
USD/CAD started to descend. The trading instrument set the new local minimums. The quotes are testing support at 1.34250 with 1.34550 acting as a mirror resistance. The market participants are waiting for important reports from the US. USD/CAD has prospects for further descend, you should open positions from the key levels.
The Economic News Feed for 16.05.2019 is calm.
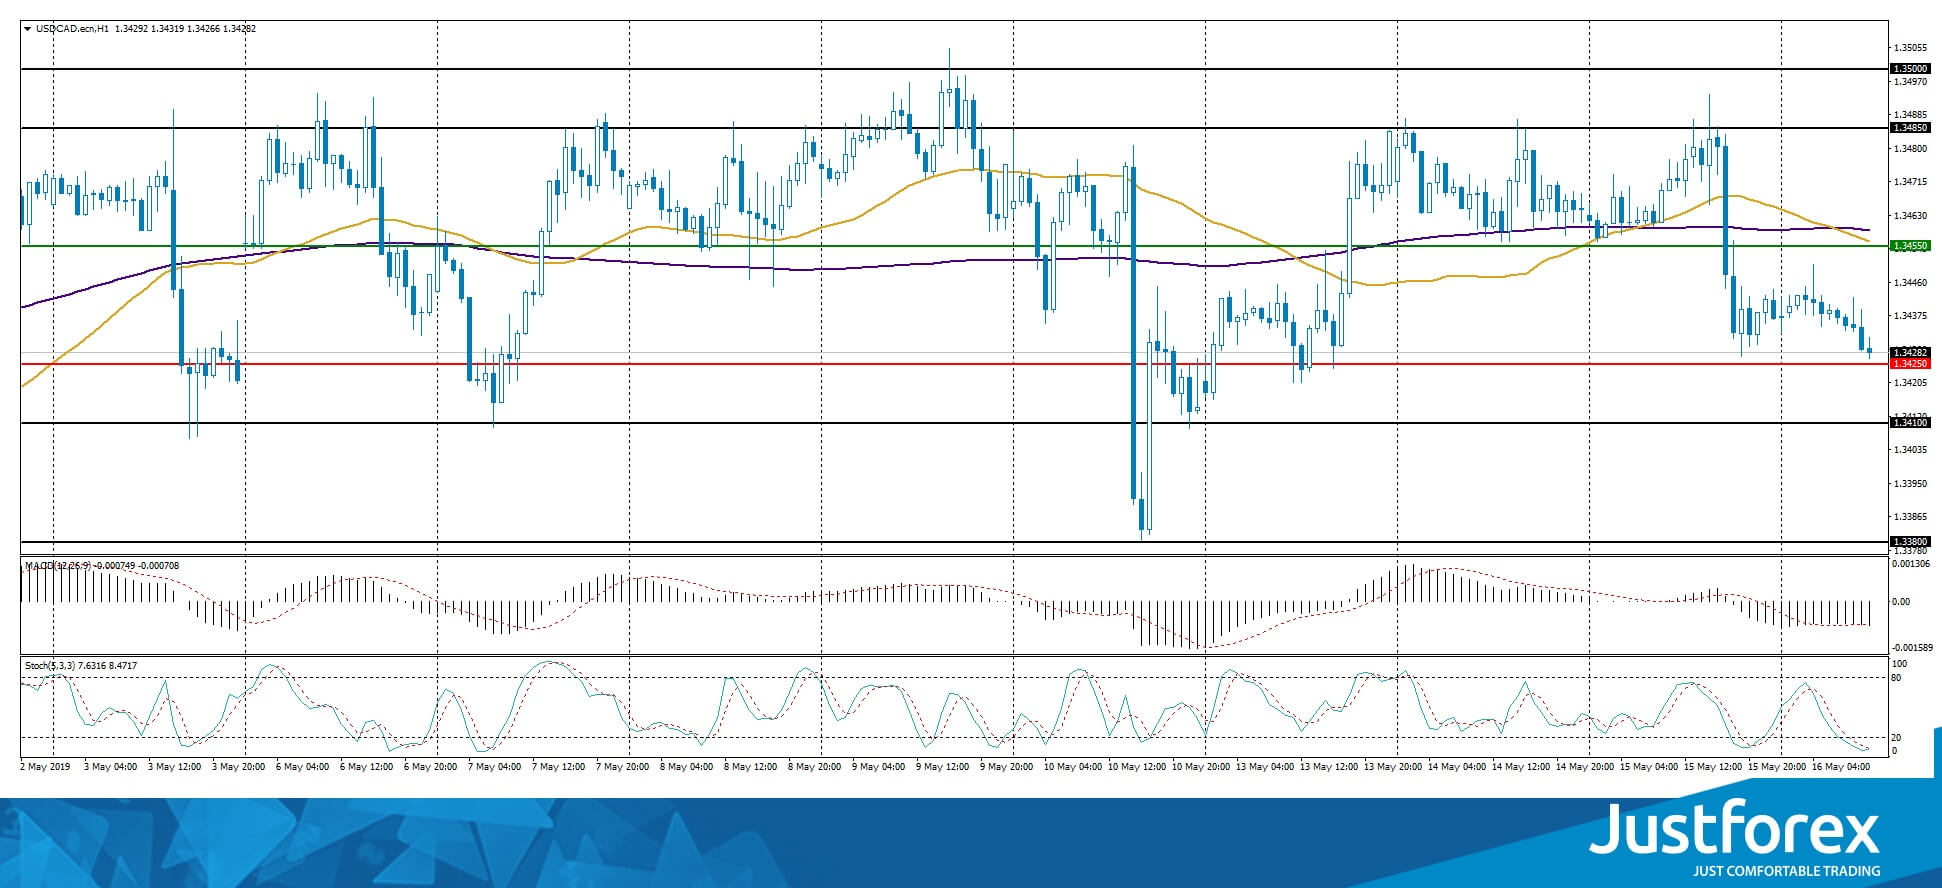
The price fixed below 50 MA and 200 MA which points to the power of the sellers.
The MACD histogram is in the negative zone and below the signal line which gives a strong signal to sell USD/CAD.
The Stochastic Oscillator is in the oversold zone, the %K line is crossing the %D line. There are no signals at the moment.
Trading recommendations
Support levels: 1.34250, 1.34100, 1.33800
Resistance levels: 1.34550, 1.34850, 1.35000
If the price fixes below 1.34250, expect further descend toward 1.34000-1.33800.
Alternatively, the quotes can grow toward 1.34700-1.34850.
The USD/JPY currency pair
Technical indicators of the currency pair:
Prev Open: 109.620
Open: 109.584
% chg. over the last day: -0.13
Day’s range: 109.335 – 109.591
52 wk range: 104.97 – 114.56
USD/JPY keeps trading in a flat. There is no defined trend, the local support and resistance are at 109.350 and 109.750. The trading instrument has further recovery prospects. The market participants are waiting for important releases from the US. Keep an eye on the US Treasury bonds’ yield and open positions from the key levels.
The Economic News Feed for 16.05.2019 is calm.
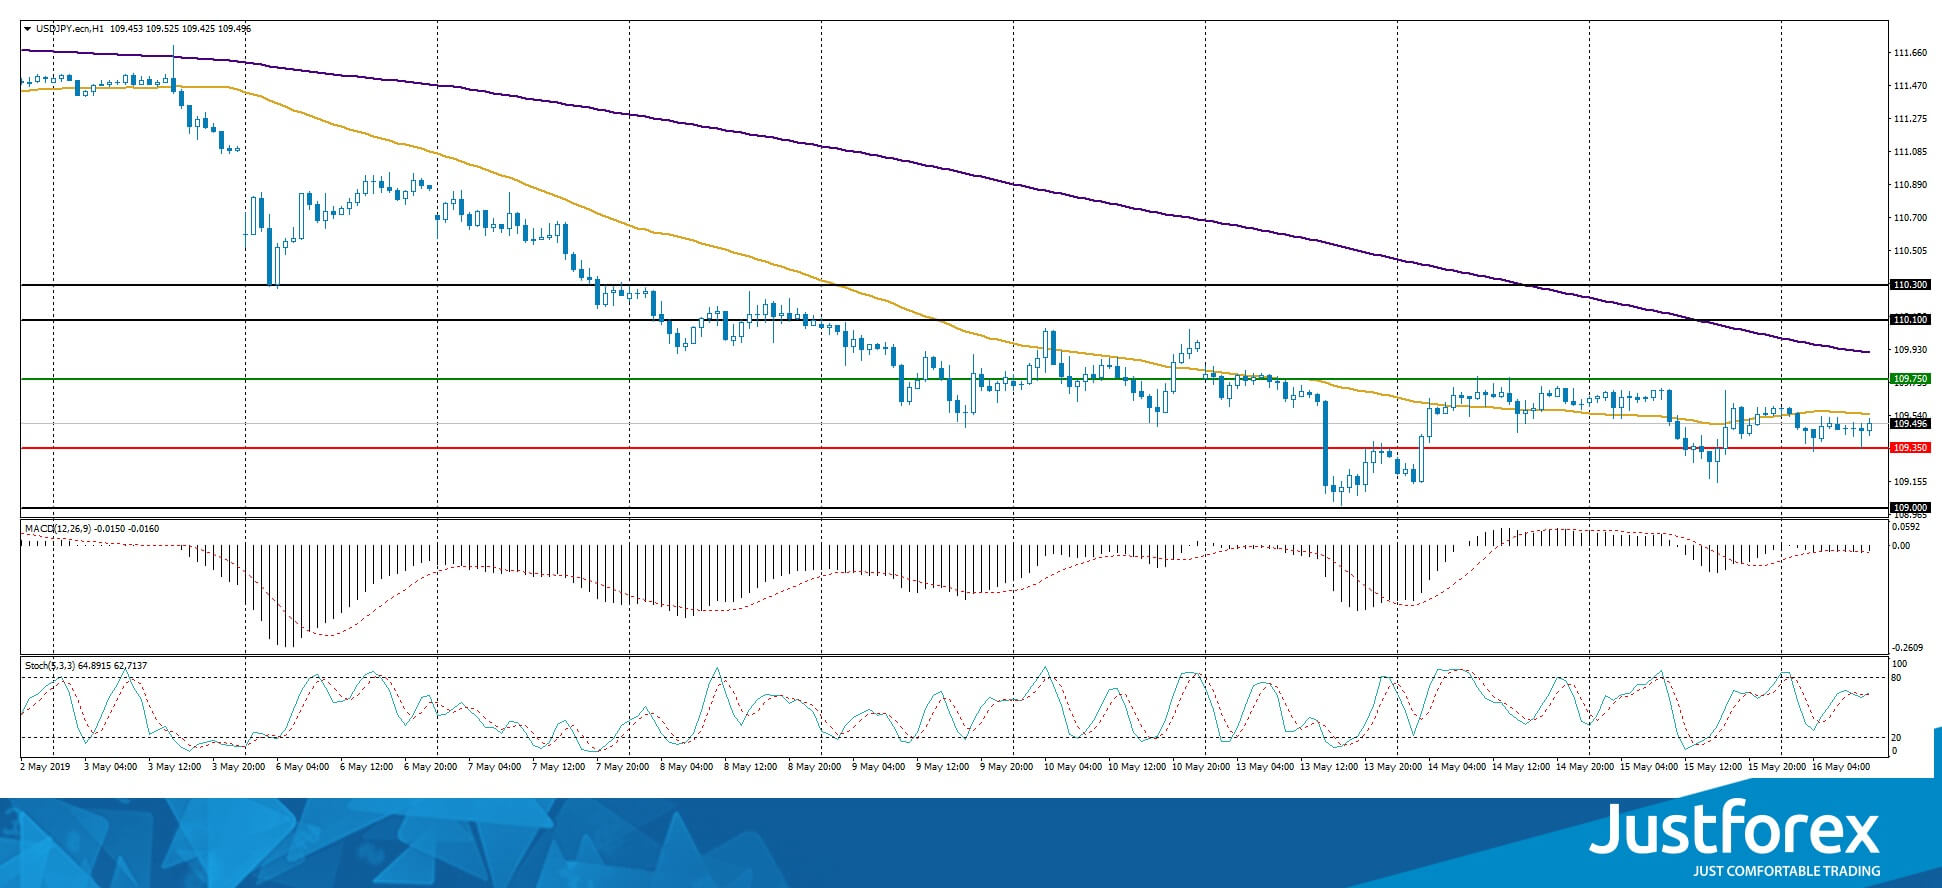
The indicators do not provide precise signals, the price has crossed 50 MA.
The MACD histogram is in the negative zone but above the signal line which gives a weak signal to sell USD/JPY.
The Stochastic Oscillator is in the neutral zone, the %K line is crossing the %D line. There are no signals at the moment.
Trading recommendations
Support levels: 109.350, 109.000
Resistance levels: 109.750, 110.100, 110.300
If the price fixes above 109.750, expect further correction toward 110.100-110.300.
Alternatively, the quotes can fall toward the round 109.000.


