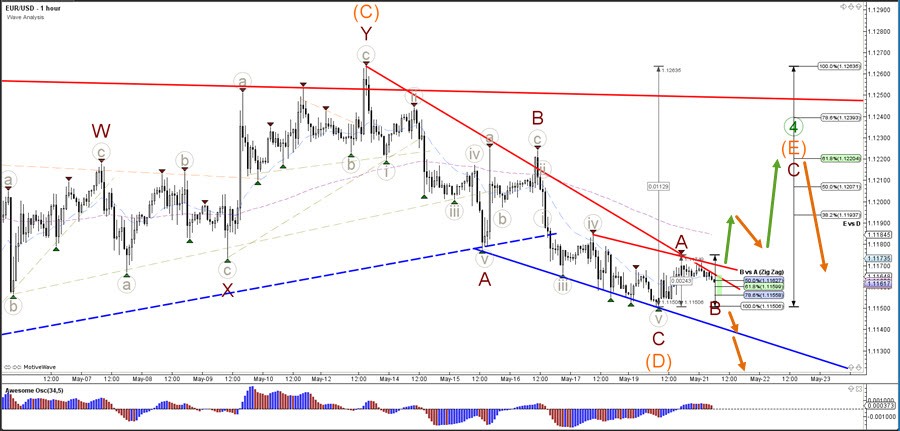
The EUR/USD is testing the Fibonacci retracement levels of wave D vs B again. A break below the 100% Fib level confirms a bearish breakout and downtrend whereas a bullish breakout above the resistance (red) trend line could indicate the start of the wave E (orange).
The EUR/USD pullback could be a wave B (dark red) of a larger bullish ABC (dark red) zigzag pattern in wave E (orange) of wave 4 (green) if price bounces at the Fibs of wave B vs A. A bearish breakout, however, indicates that the triangle pattern has most likely been completed.