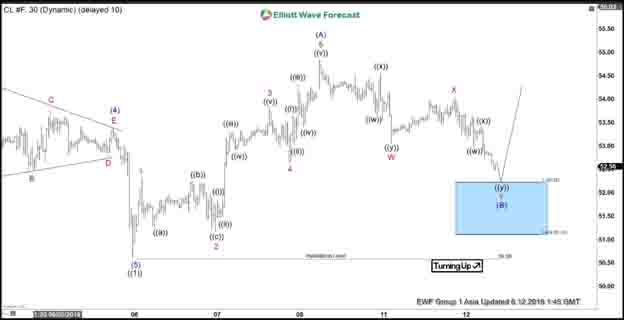
Elliott wave view suggests the decline to 50.58 in Oil ended wave ((1)). Up from there, the rally unfolded as a 5 waves impulse Elliott Wave structure. Wave 1 ended at 52.32, wave 2 pullback ended at 51.17, wave 3 ended at 53.83, wave 4 ended at 52.62, and wave 5 ended at 54.84. We can see from the chart both wave 3 and 5 subdivides into another impulse of lesser degree. This 5 waves move higher ended wave (A) in higher degree. The instrument is now correcting cycle from June 5 low within wave (B) as a double three structure.
Wave W of (B) ended at 53.05, wave X of (B) ended at 54.04, and wave Y of (B) should find buyers at 51.1 – 52.22 blue box area. The instrument should then resume higher in wave (C) from this area or at least bounce in 3 waves. We don’t like selling Oil and expect another leg higher as far as pivot at 50.58 low stays intact. If Oil breaks below 50.58, then it’s possible to count the 5 waves move up from 50.58 low as part of wave C Flat from June 3 low (52.11).
Oil (CL_F) 1 Hour Elliott Wave Chart