EUR/USD
The EUR/USD pair closed the week below the 1.1200 level, down within range, as political jitters in the UK helped the greenback advancing. The common currency also suffered a setback from a less hawkish ECB, which downgraded inflation forecasts for this year and the upcoming ones, and announced QE could be extended if needed. Despite removing from its statement the ‘lower rates’ phrase, suggesting the Central Bank has taken its first step towards tapering easing, the announcement fell short of market’s expectations.
This week, the US Federal Reserve its having a ‘live’ meeting, one of those that includes new revisions and a press conference. The Fed is largely expected to raise rates by 0.25%, although soft data ever since the year started increases the possibility that the Central Bank will pause afterwards. Indeed, the world largest economy is near full employment, but soft inflation and consumption remain as the key issue that could tie policymakers´ hands. A conservative statement, more data-dependent, would see the dollar trimming its latest gains.
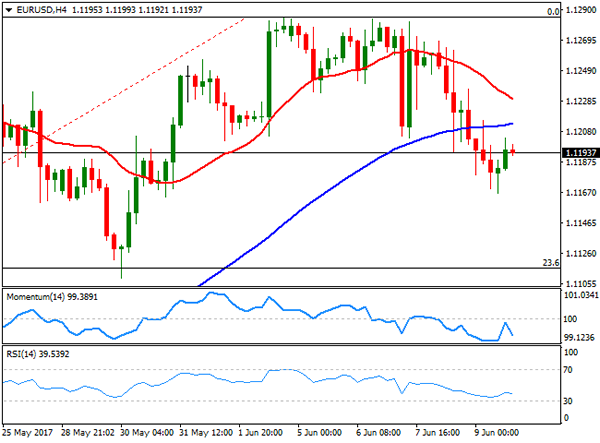
The pair traded as low as 1.1166 this Friday, and despite the upward momentum seems to be fading in the longer run, technical readings indicate that the pair is far from changing course. In the daily chart, the price has settled below a now flat 20 DMA, for the first time in almost a month, whilst technical indicators head modestly lower around their mid-lines, but the price also stands well above 1.1120, a strong static support and the 23.6% retracement of the latest bullish run between 1.0569 and 1.1284. In the 4 hours chart, the risk is towards the downside, with the price now below the 20 and 100 SMAs, and technical indicators having turned lower within negative territory. Only below 1.1080, the lowest for the last three weeks, the pair will see a steeper downward move that can extend down to 1.1010, the 38.2% retracement of the mentioned rally.
Support levels: 1.1160 1.1120 1.1080
Resistance levels: 1.1210 1.1250 1.1300
USD/JPY
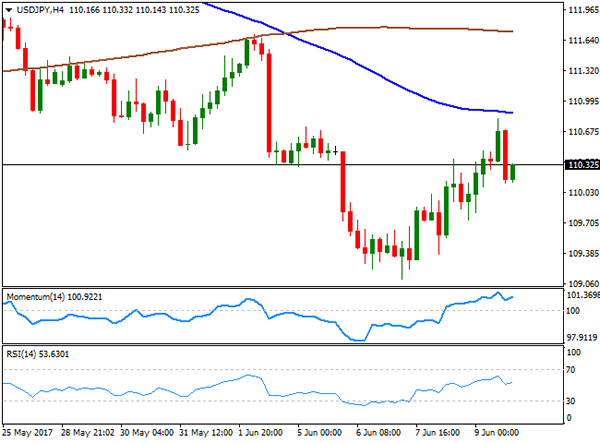
The USD/JPY pair closed the week pretty much flat at 110.32, despite edging higher on Friday for a third consecutive day. The yen remained strong as US Treasury yields tumbled to their lowest since the US election earlier this week, recovering modestly on Friday, but still near yearly lows. The recovery in yields was a result of a benign former FBI director Comey statement, which did not harm Trump’s administration further, adding nothing new to what markets already knew. The week will start with some inflation and industrial data from Japan, although the main market motor will remain to be sentiment. A negative opening in equities amid risk aversion triggered by the UK, should keep the yen on demand. Daily basis, technical readings keep favoring the downside, as indicators hold within bearish territory, whilst the 100 DMA is crossing below the 200 DMA, both now in a tight 20 pips’ range around 112.00. In the 4 hours chart, Friday’s advance was rejected by selling interest around the 100 SMA, while technical indicators have managed to bounce from their mid-lines, aiming higher but well-below their daily highs, indicating limited buying interest around the pair.
Support levels: 109.85 109.50 109.10
Resistance levels: 110.50 111.00 111.60
GBP/USD
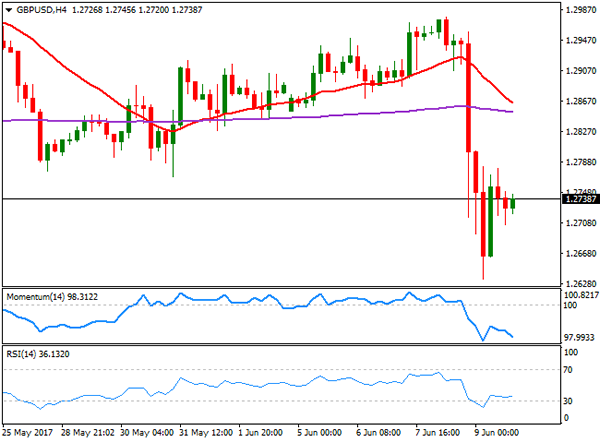
The GBP/USD pair tumbled to its lowest in nearly two months early Friday, after the Conservative leading party ended up losing seats in the House of Commons in the General Election, exactly the opposite result PM May was looking for when she called for snap elections. PM May wanted to reaffirm her leadership ahead of Brexit negotiations, but is now struggling to form a government with a hung Parliament. During the weekend her two top advisers, Nick Timothy and Fiona Hill resigned, taking responsibility for the failure in elections, after failing to communicate properly the policy programme. The Tory manifesto included several cuts in healthcare for children and elderly, and was largely criticized by opposition, as Mrs. May called for ‘big, difficult decisions’ to keep the country on track. The Pound is set to start the week with a soft tone, and even a gap lower, on the news, as political woes and uncertainty will likely push investors away from the UK currency. The GBP/USD pair stabilized around 1.2740 at the end of the week, but maintains the sour tone, with the daily hart showing that the price has broken well below a now bearish 20 DMA and technical indicators heading sharply lower within bearish territory. In the 4 hours chart, the risk is also towards the downside, as technical indicators have resumed their declines after barely correcting extreme oversold readings, whilst the price remains far below its moving averages. 1.2705, February’s high is the immediate support ahead of the 1.2660, where the pair bottomed this past week.
Support levels: 1.2705 1.2660 1.2620
Resistance levels: 1.2756 1.2800 1.2840
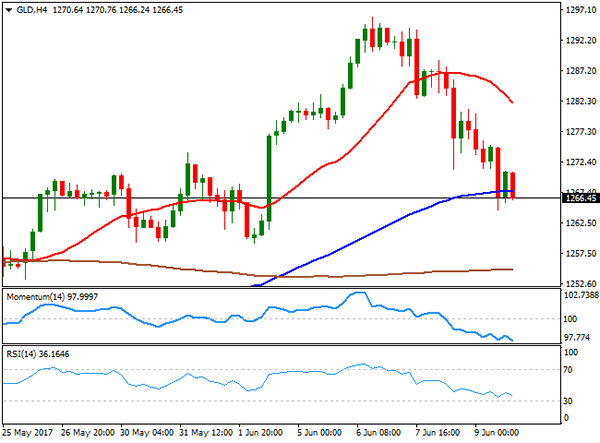
GOLD
Gold prices keep retreating on Friday, with spot ending at $1,266.45 a troy ounce after flirting with yearly highs early week, having traded as high as 1,295.90. The bright metal was undermined by resurgent dollar’s demand after risk events in the EU ended up weakening local currencies. Furthermore, former FBI director Comey’s testimony brought relief to the American currency, as it hardly affected Trump´s administration. The daily chart shows that the commodity settled around its 20 SMA, while technical indicators have turned sharply lower, and are currently nearing their mid-lines, indicating that further declines ahead are likely. In the 4 hours chart, the decline is set to continue, as the 20 SMA turned sharply lower well above the current price, whilst technical indicators resumed their declines near oversold readings. Friday’s low of 1,264.61 is the immediate support, with a break below it exposing the 1.245.50 region.
Support levels: 1,264.60 1,253.20 1,245.50
Resistance levels: 1,271.40 1,282.60 1,295.90
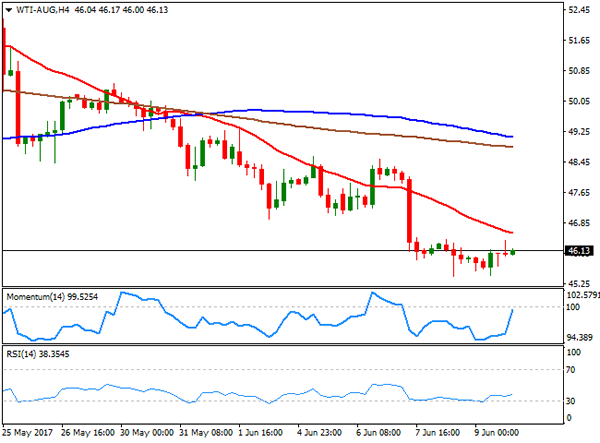
WTI CRUDE OIL
Crude oil prices spent Friday consolidating near their weekly lows, with West Texas Intermediate crude futures settling at $46.13 a barrel. Oil edged lower for a third consecutive week, undermined by an unexpected build in US inventories, and news that the number of rigs drilling oil in the country rose for a 21st consecutive week, up by eight to 741, according to the Baker Hughes weekly report. The US benchmark bottomed at 45.46 this last week, and remains at risk of falling further, as in the daily chart, the price remained capped by the 200 DMA, with the 20 DMA gaining downward strength above the current level, as technical indicators hover near oversold readings, with no signs of recovering ground. In the 4 hours chart, a strongly bearish 20 SMA leads the way lower, providing an immediate dynamic resistance around 46.60, while technical indicators have bounced from oversold readings and head up, but within negative territory.
Support levels: 45.40 44.70 44.10
Resistance levels: 46.60 47.20 47.90
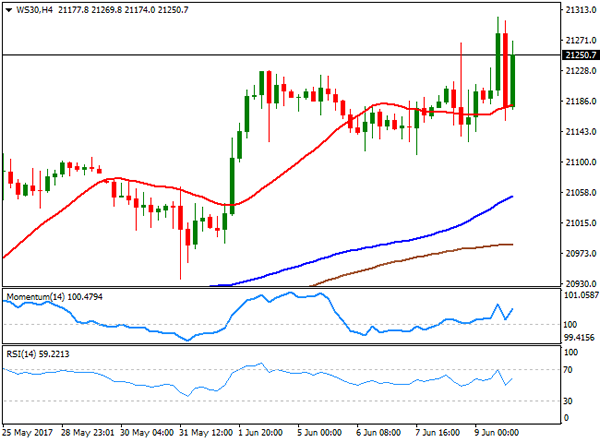
DJIA
Wall Street closed mixed on Friday, with the Dow Jones Industrial Average up 89 points and settling at a fresh record high of 21,271.97, whilst the Nasdaq Composite plunged 113 points or 1.80%, to close at 6.207.92, amid a selloff in the technology sector. The S&P closed pretty much unchanged, down 2 points to 2,431.77. Leading the advance in the DJIA was Pfizer, up 3.21%, followed by JP Morgan that added 2.37%. Also up were energy-related equities, as oil prices stabilized after the early week slump. The worst performers were Apple, down 3.88% and Microsoft that shed 2.27%. Holding near its highs, the daily chart for the index shows that it stands above all of its moving averages, while the Momentum indicator remains flat within positive territory, and the RSI indicator heads north around 67, maintaining the risk towards the upside. In the shorter term, and according to the 4 hours chart, the DJIA presents a neutral-to-bullish stance, holding above a horizontal 20 SMA, and with technical indicators bouncing modestly from their mid-lines.
Support levels: 21,228 21,170 21,125
Resistance levels: 21,303 21,350 21,400
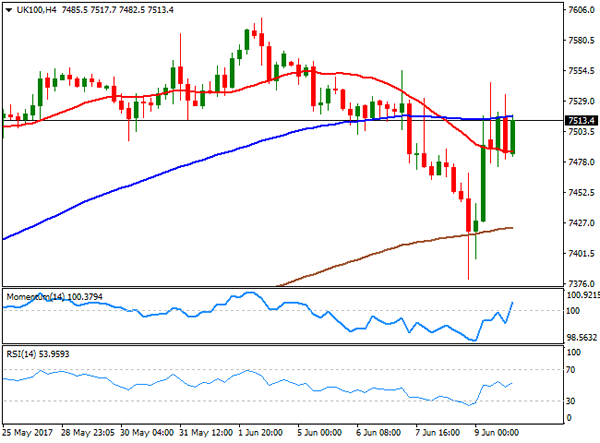
FTSE100
The FTSE 100 reversed course on Friday and advanced sharply on a plunging Pound, ending the week anyway in the red at 7,527.33. The index added 78 in the last day of the week as it’s made up of multinationals that benefit from a weaker sterling, also underpinned by rising mining-related equities. Smurfit Kappa was the best performer, up by 5.03%, followed by Fresnillo and Antofagasta that added 3.60% and 3.51% respectively. Taylor Wimpey led decliners with a 3.27% lost, followed by Babcock International that shed 2.92%. The daily chart shows that the recovery stalled around a flat 20 DMA, while technical indicators turned north, but stand around their mid-lines, not enough at this point to support additional gains, although a break above 7,540, the immediate resistance area, would favor so. In the shorter term, the risk is also towards the upside, technical indicators head north above their mid-lines, although the price is also stuck around moving averages, in line with the longer term perspective.
Support levels: 7,482 7,445 7,405
Resistance levels: 7,541 7,588 7,620
DAX
The German DAX added 102 points or 0.80%, settling for the week at 12,815.72. European equities closed higher, backed by a modest bounce in oil prices, and after the ECB on Thursday upgraded its growth forecast for the region, while reaffirming the need of monetary easing. Within the DAX BASF was the best performer, adding 2.15%, followed by Deutsche Lufthansa that added 2.01%. On the losing side were RWE AG that closed 1.84% lower, followed by SAP that lost 1.24%. The daily chart for the German benchmark presents a neutral-to-bullish stance, as despite seesawing all through the week, it held above a flat 20 DMA, while technical indicators have bounced modestly from their mid-lines, although lacking enough momentum to confirm additional gains ahead. In the shorter term, and according to the 4 hours chart, the risk is also towards the downside, as the index stands above all of its moving averages, whilst technical indicators have bounced modestly from their mid-lines, still holding below Friday’s highs.
Support levels: 12.734 12,671 12,620
Resistance levels: 12,791 12,834 12,881