EUR/USD
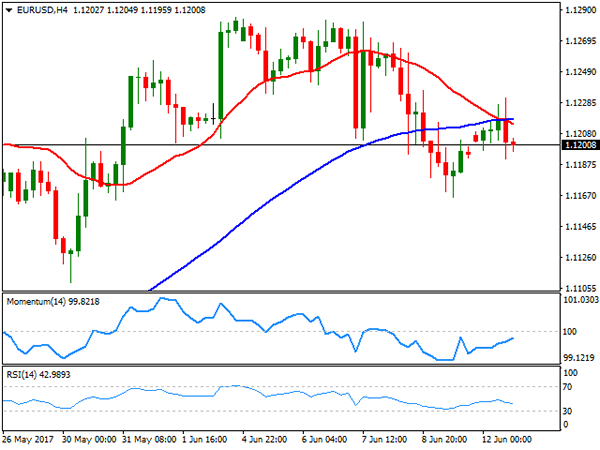
The EUR/USD pair managed to post a tepid advance this Monday, but closed the day pretty much flat around 1.1200, as investors stand cautious ahead of a busy Central Bank’s week, which includes the Fed, the BOE and the BOJ. Despite persistent Pound´s weakness amid political uncertainty, the American dollar traded lower against its major counterparts, with the EUR/USD pair peaking at 1.1231, but retreating on comments from ECB’s Coeure, who said that it’s too early to discuss tapering.
In Europe, the only relevant news came from France, as Emmanuel Macron’s centrist La Republique En Marche won a huge majority in the French Parliament´s first round of voting, expected to get between 415-455 seats out of 577. The good news, however, is not enough to affect the common currency. The macroeconomic calendar had nothing to offer this Monday, but will become more interesting this Tuesday, with multiple figures coming from Germany, including June ZEW’s survey, and US PPI.
The technical picture for the pair is short term neutral-to-bearish as in the 4 hours chart, the pair was contained by selling interest around a congestion of moving averages, as the 20 and 100 SMAs converge in the 1.1220 region. In the same chart, the Momentum indicator continues heading higher, but below its 100 level, while the RSI indicator turned south, now around 42 and anticipating some additional declines ahead. Still, unless a break below 1.1080, the downward potential will remain limited.
Support levels: 1.1160 1.1120 1.1080
Resistance levels: 1.1210 1.1250 1.1300
USD/JPY
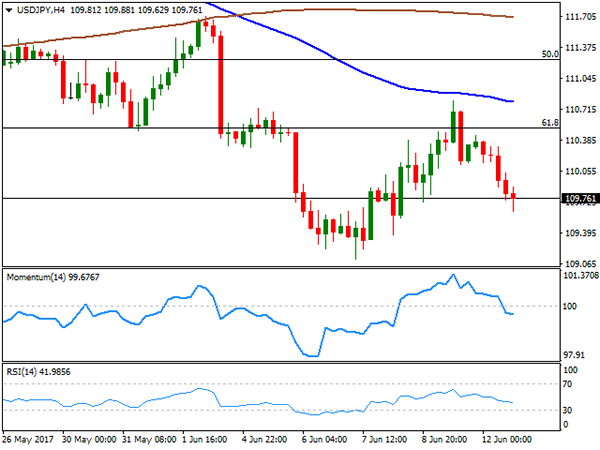
The USD/JPY pair closed the day in the red, as the negative tone of worldwide equities kept the yen on demand at the beginning of the week. With no relevant news coming from the US, the pair traded on the back of sentiment, unable to get clues this time from yields, as US Treasury’s benchmarks remained stable all through the day. Both Central Banks will have monetary policy meetings this week, with the Fed scheduled for Wednesday and the BOJ a few hours later. The US Central Bank will likely determinate the fate of the pair, although given the dominant bearish trend, a hawkish surprise from the Fed will hardly be sustainable in time. Holding below 110.00, the pair traded as low as 109.62, now the immediate support, ahead of 109.11, the multi-month low set last week. Technical readings in the 4 hours chart support a downward extension, as the pair failed to recover above 110.50, the 61.8% retracement of its April/May bullish run, with technical indicators now consolidating within negative territory and the price well below its 100 and 200 SMAs.
Support levels: 109.60 109.20 108.75
Resistance levels: 110.10 110.50 111.00
GBP/USD
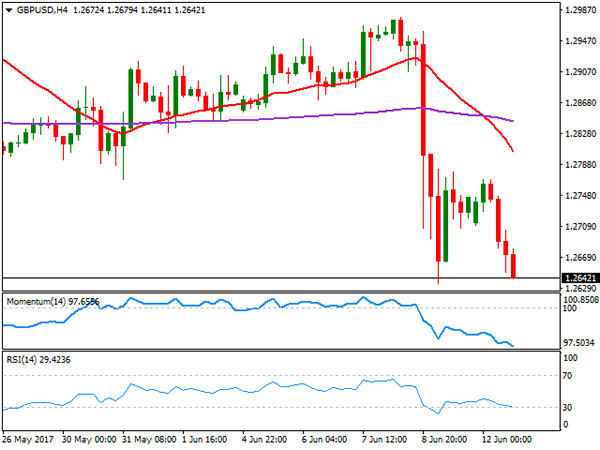
The GBP/USD pair fell at the beginning of the week, paring losses a few pips above the multi-month set last week at 1.2634, but with the Pound clearly undermined by political uncertainty in the UK. Domestic woes are coupling with the upcoming Brexit negotiation, set to begin next week, with PM May’s still to form a government. Her defeat in the latest election has arose speculation that the UK may have to choose a softer Brexit, although PM Davis reaffirmed earlier today the current stance favoring a hard one. Fueling the ongoing uncertainty, a meeting in Brussels between EU Michel Barnier and UK Oliver Robbins ended up with the economies failing to agree on a start date for Brexit negotiations. The pair retains a strong negative momentum heading into the Asian opening, with lower lows still to be expected. Short term, the 4 hours chart shows that technical indicators continue heading lower, despite being in oversold readings, whilst the 20 SMA accelerated its decline far above the current level and now below the 200 EMA, in line with the ongoing downward move.
Support levels: 1.2630 1.2590 1.12550
Resistance levels: 1.2660 1.2707 1.2760
GOLD
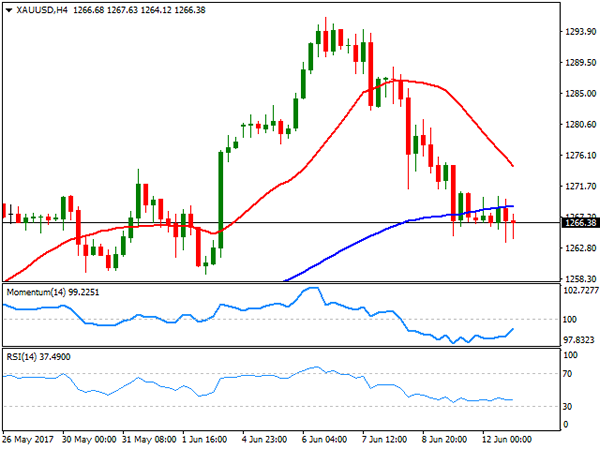
Gold prices saw little action at the beginning of the day, ending it flat despite generally stronger base metals. Spot closed at $1,266.47 a troy ounce, having posted a lower high and a lower low daily basis, this last at 1,263.53. In Asia, the commodity edged lower for a fourth consecutive day, amid low demand from local jewelers and retailers. Daily basis, the metal closed right below its 20 SMA, while technical indicators have kept retreating within positive territory, now resting around their mid-lines. In the same chart, the 100 and 200 DMAs stand flat below the current level, all of which indicates fading upward momentum, but is not enough to confirm an upcoming decline. In the 4 hours chart, the price remained stuck around its 100 SMA, while the 20 SMA maintains its bearish slope above the current level as technical indicators head nowhere within negative territory.
Support levels: 1,263.50 1,253.20 1,245.50
Resistance levels: 1,271.40 1,282.60 1,295.90
WTI CRUDE OIL
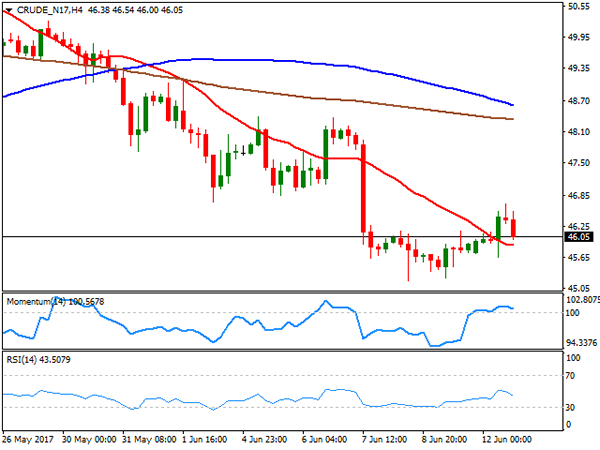
West Texas Intermediate crude oil futures closed the day a few cents lower this Monday at $46.05 a barrel. Oil prices rose intraday after Saudi Arabia announced it will limit the volumes sold to some Asian countries in July, to a total of 300,000 barrels per day, coupling with speculation that the US stockpiles have fallen for nearly 2 million barrels at the Cushing, Oklahoma delivery point last week. Prices, however, were unable to hold on to gains, and from a technical point of view, the risk remains towards the downside. The daily chart for WTI shows that the Momentum indicator has partially corrected within negative territory before resuming its decline, while the RSI indicator consolidates around 34. Moving averages in the mentioned chart, keep gaining downward strength above the current level. In the shorter term, and according to the 4 hours chart, the technical stance is neutral, as the price hovers a few cents above a horizontal 20 SMA, the Momentum indicator remains stuck around its 100 level, while the RSI also lacks directional strength around 42.
Support levels: 45.40 44.70 44.10
Resistance levels: 46.60 47.20 47.90
DJIA
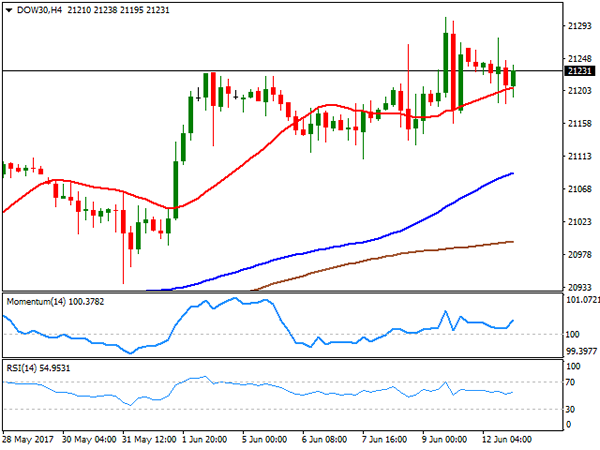
A continued decline in tech-related equities sent Wall Street lower this Monday. The fall began last Friday, following reports that Apple was using slower modems in upcoming iPhones, compared with those used by rivals. The Dow Jones Industrial Average lost 36 points, to end at 21,235.67, while the Nasdaq Composite shed 32 points, to 6,175.47. The S&P ended at 2,429.39, down by 2 points. Within the Dow, General Electric led advancers, up 3.79% after its CEO resigned, followed by Chevron that gained 1.38%, as a modest advance in oil prices at the beginning of the American session fueled demand for energy-related equities. Apple was the worst performer for a second consecutive session, down 2.71%, followed by McDonald’s that shed 1.97%. The DJIA daily chart shows that the index remains in a consolidative phase above all of its moving averages, whilst technical indicators keep retreating modestly within positive territory. In the shorter term, and according to the 4 hours chart, the index holds a few points above its 20 SMA, while technical indicators turned modestly higher from their mid-lines, lacking enough upward momentum to confirm an upcoming bullish movement.
Support levels: 21,186 21,144 21,092
Resistance levels: 21,259 21,303 21,350
FTSE100
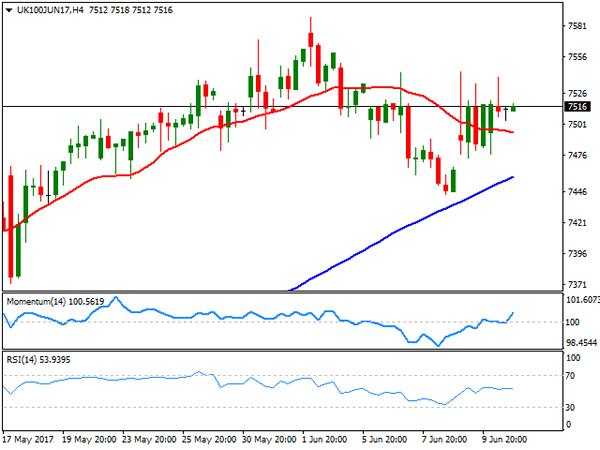
The FTSE 100 shed 15 points to end at 7,511.87, limited losses as the sour tone in some sectors was offset by a weakening Pound. UK political jitters weighed on investors’ mood, and will likely weigh until the political future becomes clearer. Johnson Matthey led the way higher within the Footsie, ending 2.04% higher, followed by Royal Dutch Shell that added 1.56%. Fresnillo was the worst performer, down 4.87%, followed by Micro Focus that lost 3.80%. The index, however, held above a bullish 20 DMA in the daily chart, albeit the Momentum indicator remains flat around its 100 line whilst the RSI indicator presents a modest upward potential, currently around 61, all of which limits chances of a downward move. In the 4 hours chart, the technical outlook is neutral-to-bullish, as it holds above all of its moving averages, whilst technical indicators turned higher within positive territory, although the index will need to surpass Friday’s high at 7,544, to confirm another leg higher for this Friday.
Support levels: 7,482 7,445 7,405
Resistance levels: 7,541 7,588 7,620
DAX
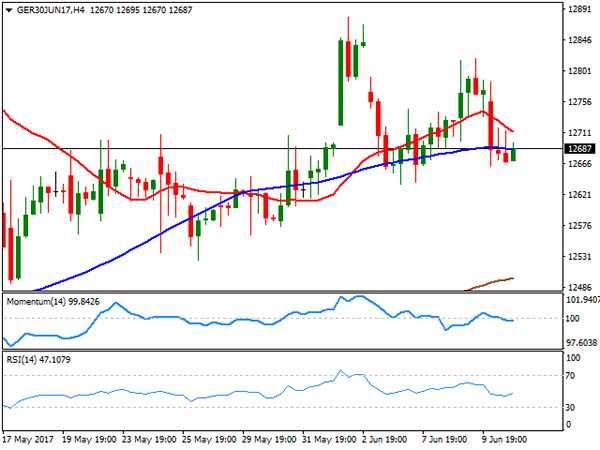
European equities followed the lead of their Asian counterparts, with the German DAX closing at 12,690.44, down 23 points or 0.18%. The tech sector led the decline, after Friday’s sell-off in Wall Street, while uncertainty over UK’s political leadership also weighed on investors’ mood. Within the German benchmark, Infineon was the worst performer, down 3.11%, followed by SAP that shed 2.42%, and Deutsche Bank that closed 2.13% lower. Volkswagen on the other hand, was the best performer, adding 2.17%, followed by Heidelberg Cement that gained 1.90%. The technical outlook is little changed, with the index now neutral and partially losing its previous bullish stance, but still far from bearish. The benchmark is currently hovering around its 20 DMA, while technical indicators turned lower within neutral territory. In the 4 hours chart, the DAX is right below a modestly bearish 20 SMA and hovering around a horizontal 100 SMA, while technical indicators head nowhere around their mid-lines.
Support levels: 12,662 12,620 12,569
Resistance levels: 12,734 12,791 12,834