
Can oil continue to rally?
Prior to the latest eruption in the crypto space, Brent crude (oil) was looking like the volatile player in the market but these moves pale in comparison.
Oil prices have sprung back to life over the last couple of weeks, aided this week by huge inventory drawdowns, as reported by API and then to an even greater extent by EIA, who reported the largest reduction in stocks in almost three years.
Whether prices can continue to rise will likely depend on how the meeting in Osaka goes over the next couple of days. Global growth risks are a major downside risk for oil prices, although they have been overshadowed the last couple of weeks by geopolitical flare ups, inventory declines and the prospect of an OPEC+ cut extension. I do wonder whether recent price action may put that at risk next week though.
Brent Daily Chart
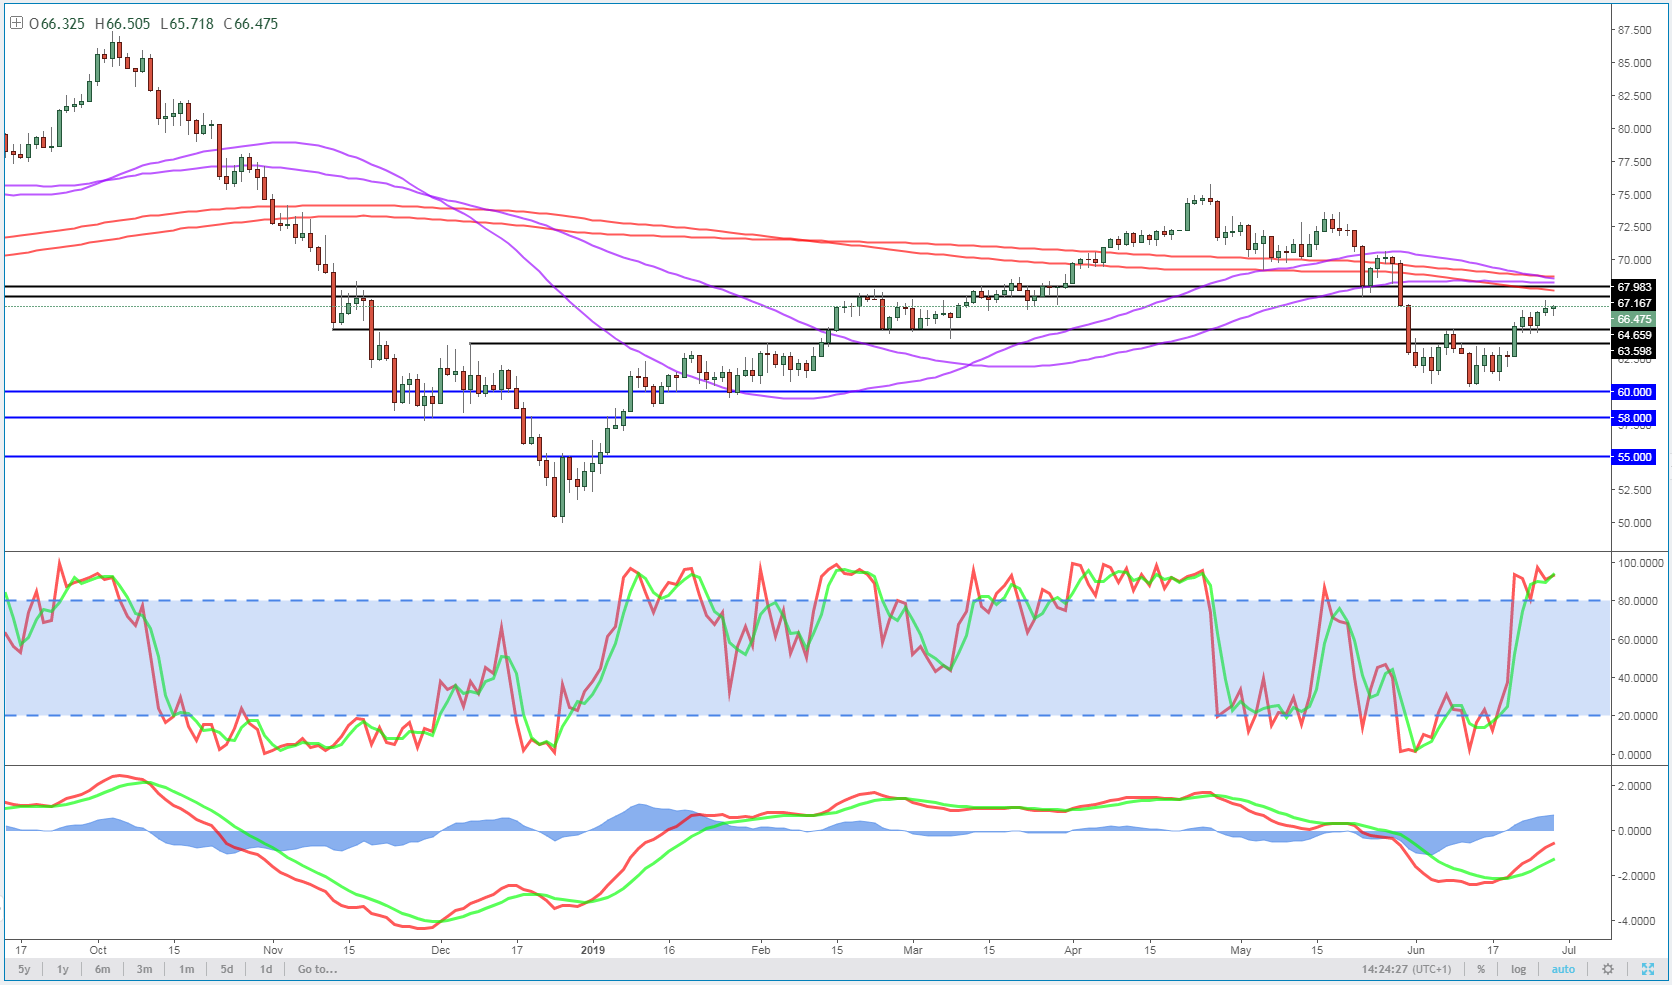
As previously suggested, $67-68 looks to be providing some resistance to the rally, with it having stalled a little again yesterday. The momentum indicators still look healthy on the daily chart though so we may see further runs at this area.
Brent 4-Hour Chart
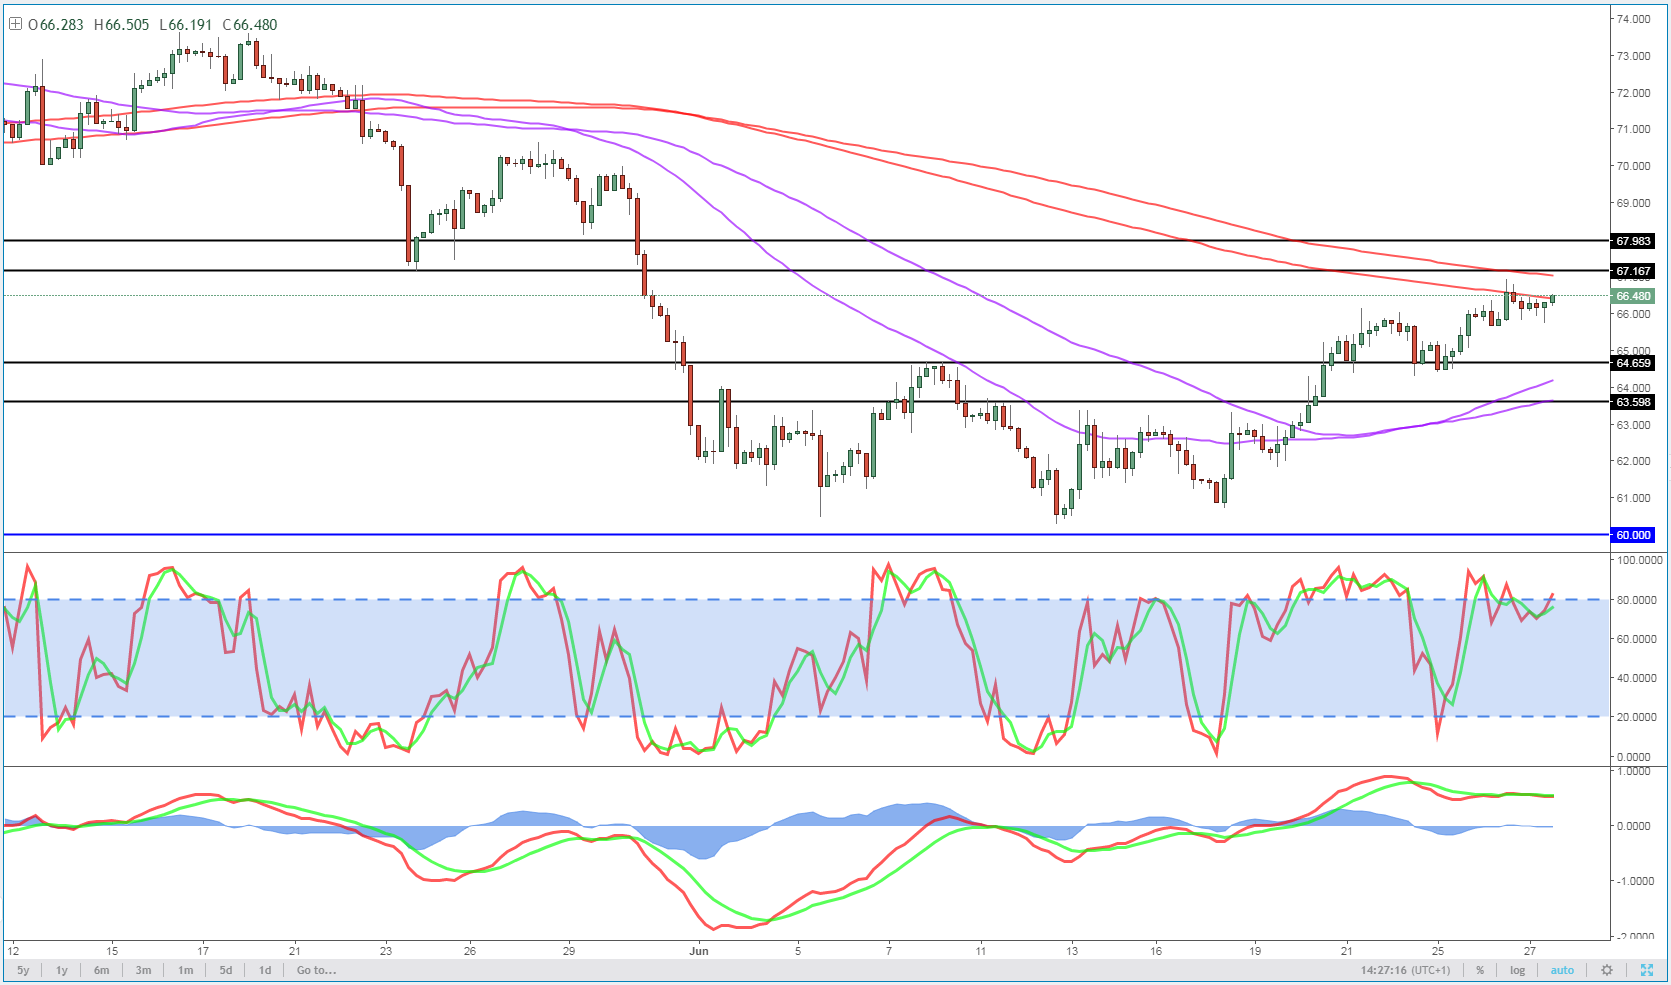
The 4-hour chart looks less convincing, with both the MACD and stochastic diverging from price, indicating a weakening of the near-term trend. This comes around the 200/233-period simple moving average band which may be contributing to the softening in the rally.


