
The EUR/USD currency pair
Technical indicators of the currency pair:
Prev Open: 1.12841
Open: 1.12776
% chg. over the last day: -0.03
Day’s range: 1.12776 – 1.12951
52 wk range: 1.1111 – 1.2009
EUR/USD continues to consolidate. There is no defined trend. The local support and resistance levels are 1.12750 and 1.13100. Financial market participants took a wait-and-see attitude until the US labor market report for June, which will be published on Friday July 5th. Today trading activity and volatility may be reduced due to the celebration of Independence Day in the United States. We recommend to open positions from key levels.
At 12:00 (GMT + 3:00) the EU will publish a report on the volume of retail sales.
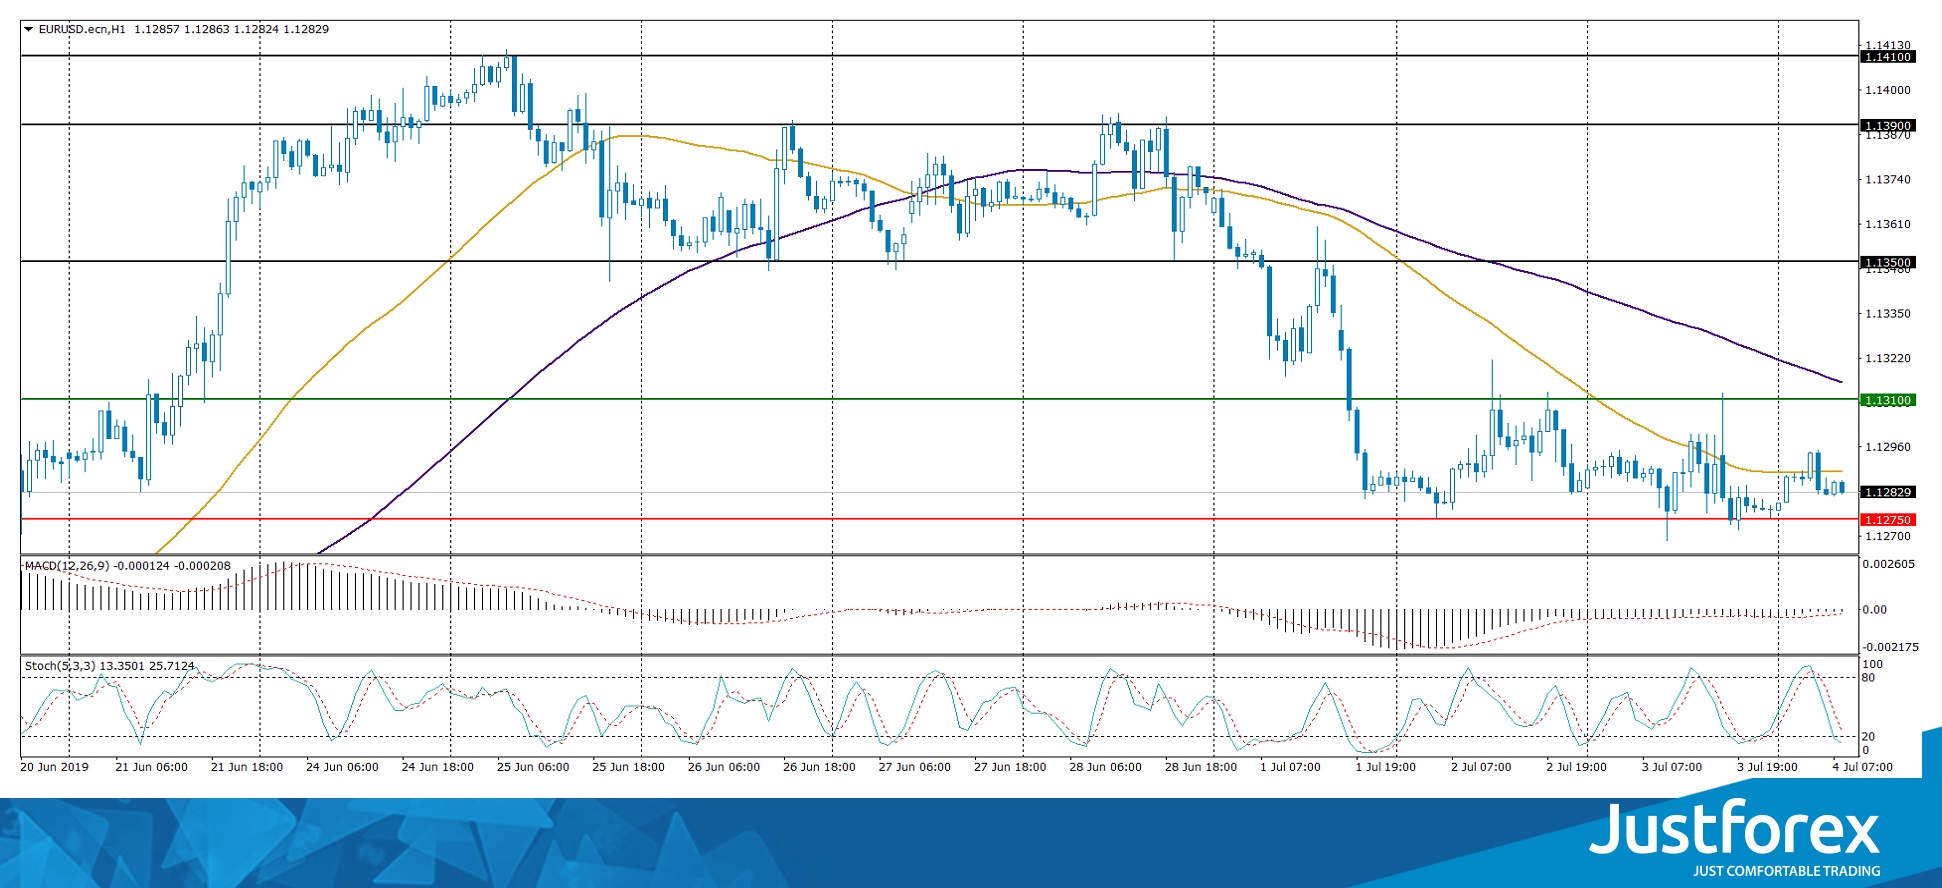
The indicators do not give accurate signals: the price crossed 50 MA.
The MACD histogram is close to the 0 mark.
Stochastic Oscillator is in the neutral zone, the% K line is below the% D line, which indicates bearish moods.
Trading recommendations
Support levels: 1.12750, 1.12400
Resistance levels: 1.13100, 1.13500, 1.13900
If the price fixes below 1.12750, expect further descend towards 1.12400-1.12200.
Alternatively, the quotes can recover toward 1.13400-1.13600.
The GBP/USD currency pair
Technical indicators of the currency pair:
Prev Open: 1.25907
Open: 1.25647
% chg. over the last day: -0.08
Day’s range: 1.25623 – 1.25913
52 wk range: 1.2438 – 1.3631
GBP/USD has stabilized after a sharp fall since the beginning of the current week. GBP is consolidating. The key support and resistance levels are 1.25600 and 1.26000. GBP remains under pressure due to weak business activity in the UK. GBP/USD quotes can decline further. The positions must be opened from key levels.
Today, the news background on the UK economy is calm. We recommend to keep up to date information on Brexit.
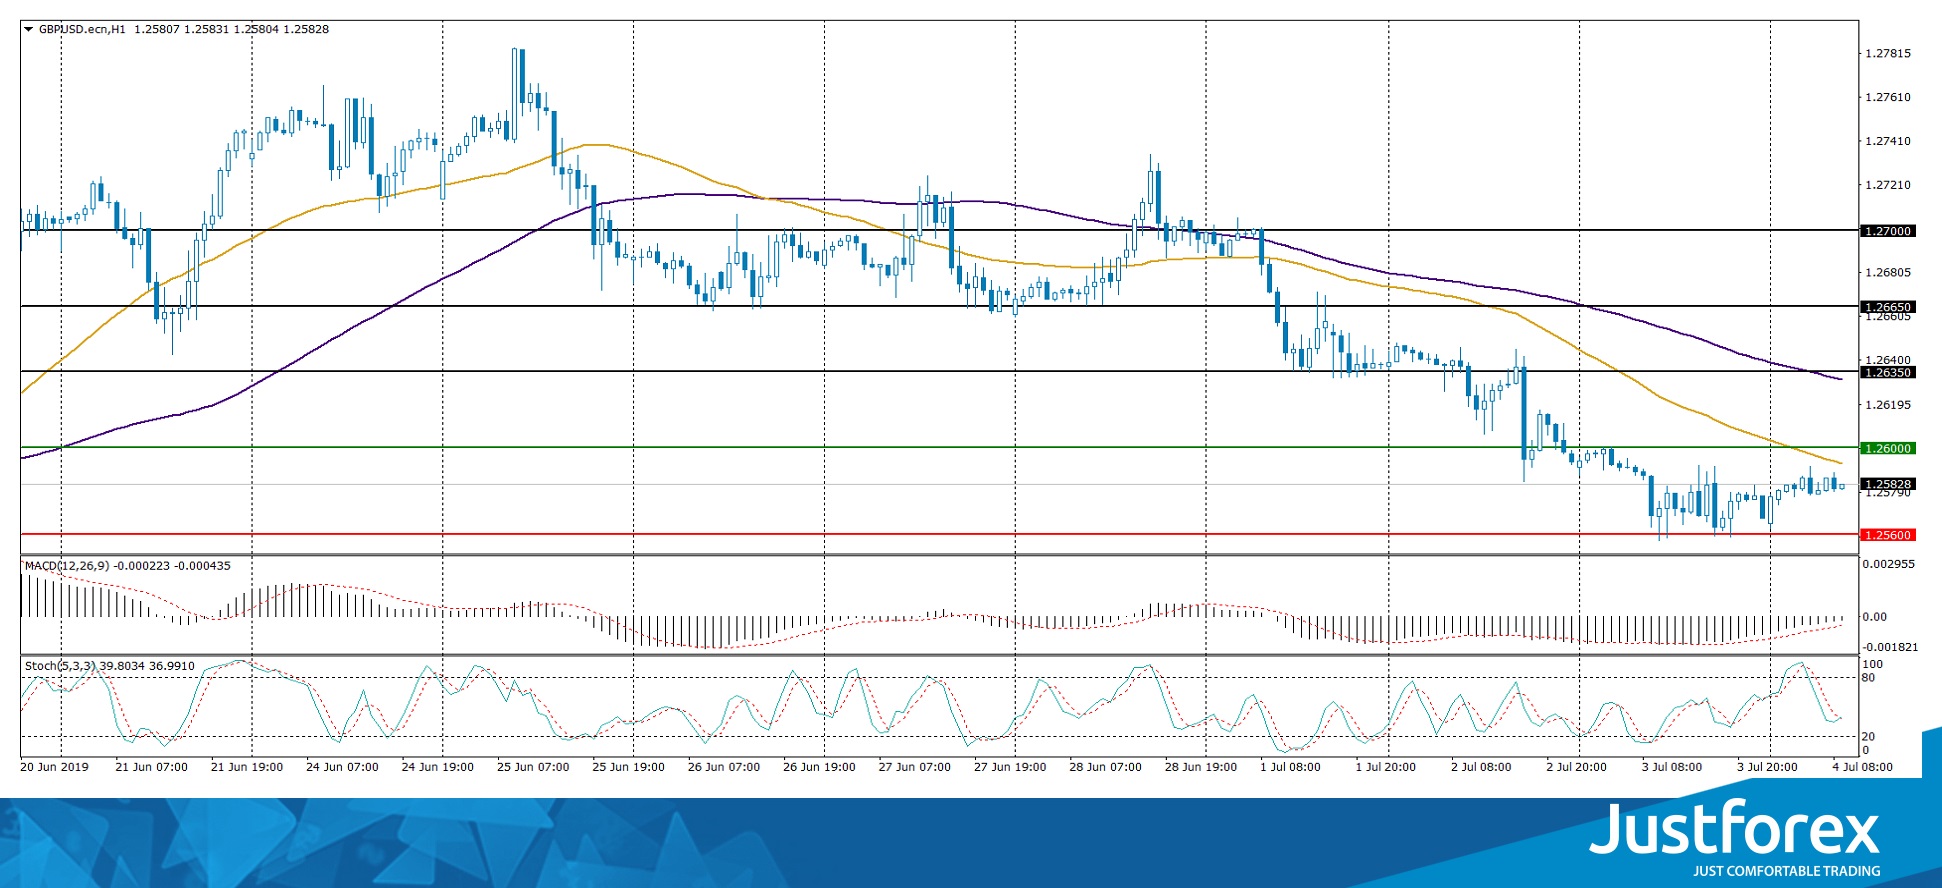
The price has fixed below 50 MA and 100 MA, which indicates the power of the sellers.
The MACD histogram began to rise and approached 0. There are no signals at the moment.
The Stochastic Oscillator is in the neutral zone, the %K line crossed the %D line. At the moment, there are no accurate signals.
Trading recommendations
Support levels: 1.25600, 1.25300, 1.25000
Resistance levels: 1.26000, 1.26350, 1.26650
If the price consolidates below 1.25600, expect a decline toward 1.25300-1.25000.
Alternatively, the quotes can grow toward 1.26300-1.26500.
The USD/CAD currency pair
Technical indicators of the currency pair:
Prev Open: 1.31055
Open: 1.30595
% chg. over the last day: -0.37
Day’s range: 1.30552 – 1.30733
52 wk range: 1.2727 – 1.3664
The USD/CAD currency pair has once again moved to a decline. Yesterday, the quotes fell by more than 45 points and updated local minima. CAD is consolidating, tyhe key support and resistance levels are 1.30550 and 1.30850. In the near future, we do not exclude technical correction of the trading instrument. Pay attention to the dynamics of oil prices and open positions from key levels.
The Economic News Feed for 04.07.2019 is calm.
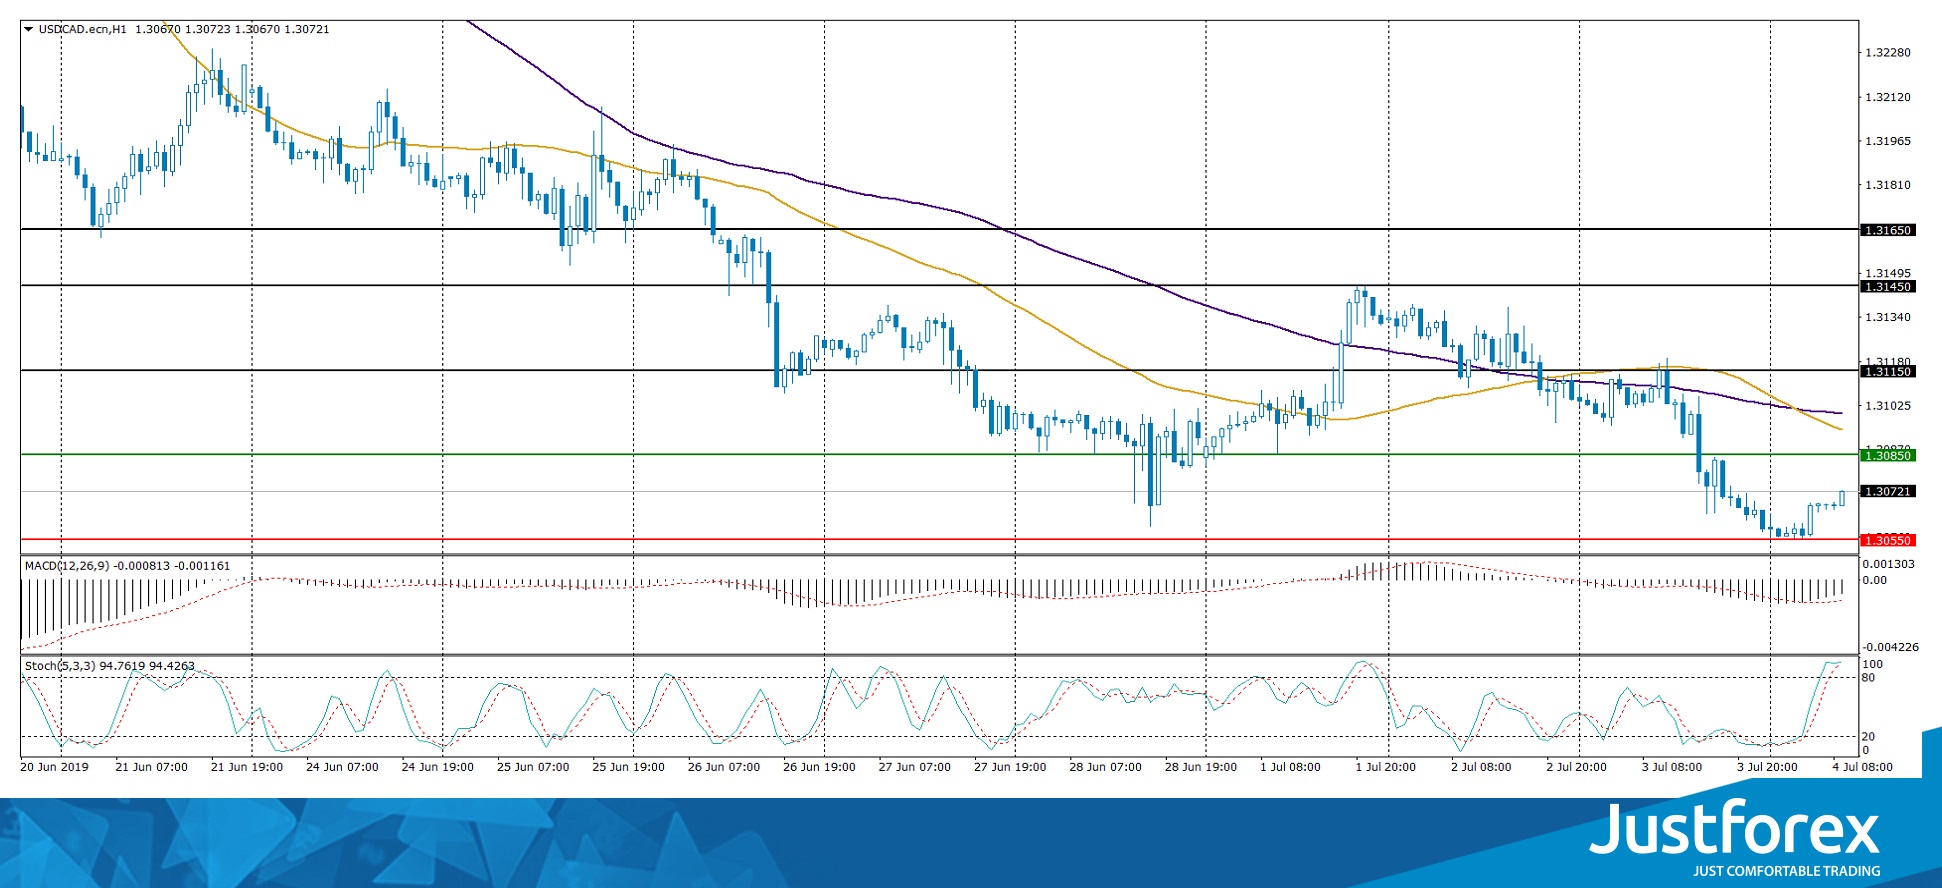
The price has fixed below 50 MA and 100 MA, which indicates the power of the sellers.
The MACD histogram is in the negative zone, but above the signal line, which gives a weak signal to sell USD/CAD.
The Stochastic Oscillator is in the overbought zone, the %K line has started to cross the %D line. There are no signals at the moment.
Trading recommendations
Support levels: 1.30550, 1.30000
Resistance levels: 1.30850, 1.31150, 1.31450
If the price consolidates above 1.30850, the quotes can rise toward 1.31150-1.31300.
Alternatively, the quotes can fall toward 1.30200-1.30300.
The USD/JPY currency pair
Technical indicators of the currency pair:
Prev Open: 108.427
Open: 107.878
% chg. over the last day: -0.56
Day’s range: 107.533 – 107.913
52 wk range: 104.97 – 114.56
The USD/JPY has gone down. During yesterday’s and today’s trading, the drop in quotes exceeded 80 pips. The trading instrument has established new local minimums. At the moment, the safe harbor currency is consolidating. The key support and resistance levels are 107.500 and 107.850, respectively. The focus is on economic reports from the United States. The technical picture signals a further drop in the USD/JPY quotes. We recommend to open positions from key levels.
The Economic News Feed for 04.07.2019 is calm.
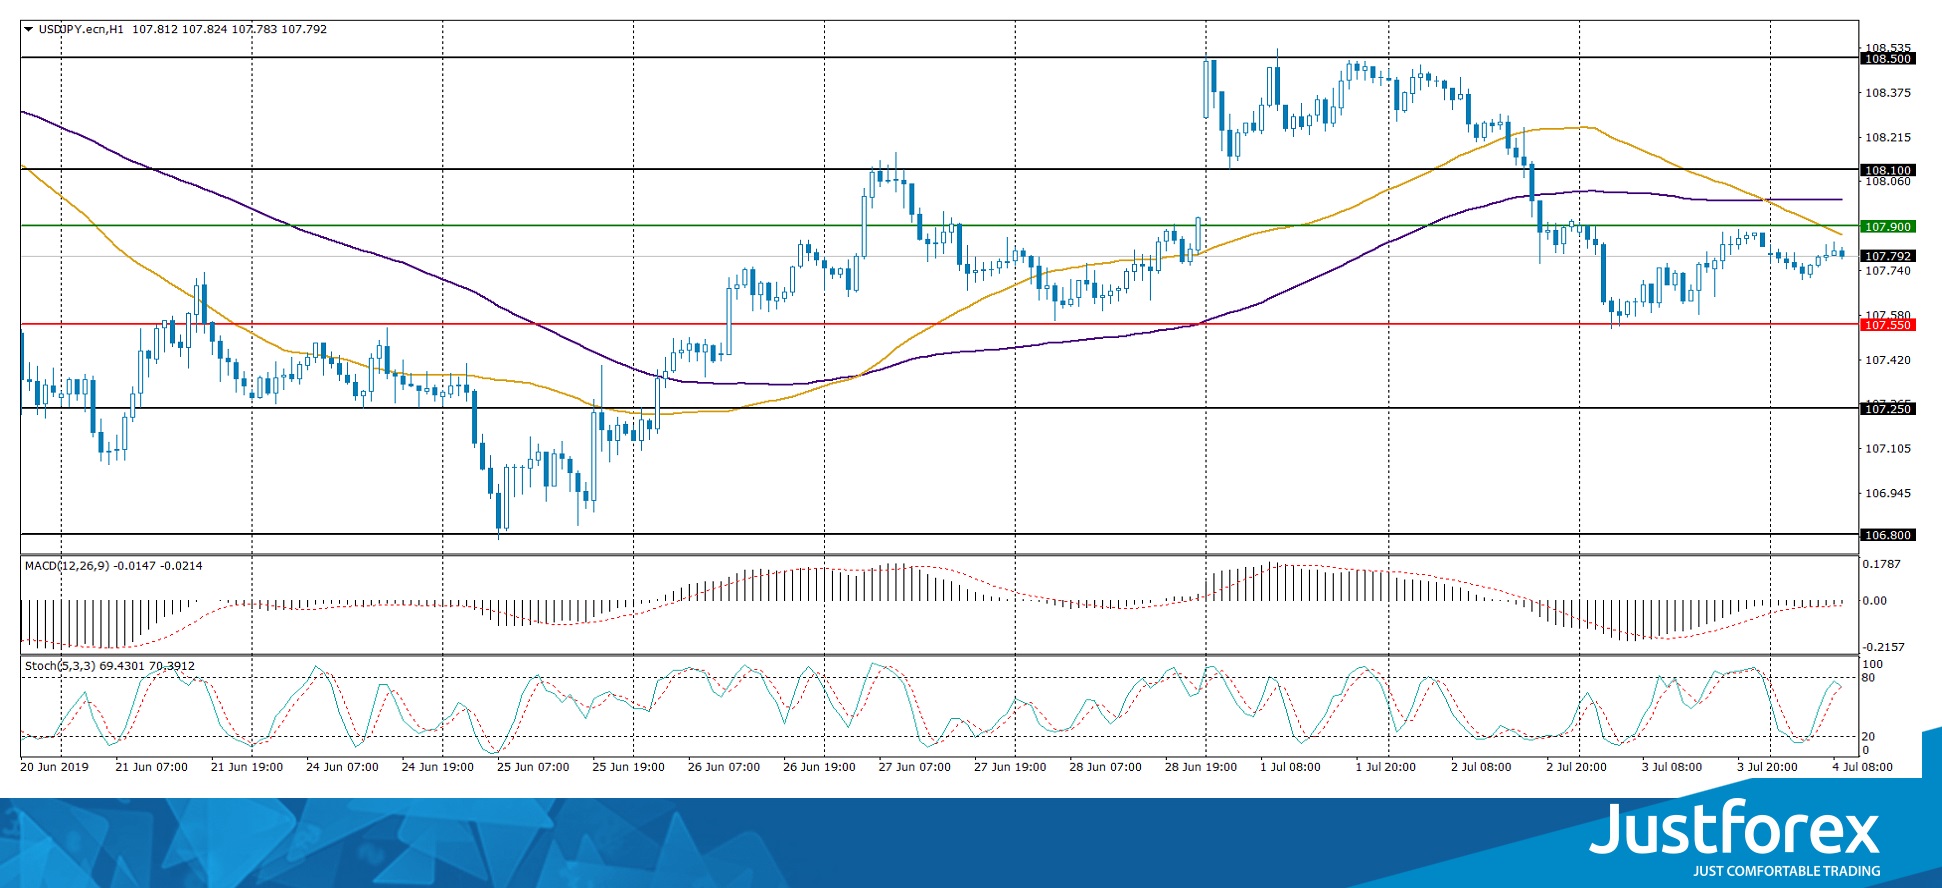
The price has fixed below 100 MA, which indicates the strength of the sellers.
The MACD histogram is in the negative zone and below the signal line, which gives a strong signal to sell USD / JPY.
The Stochastic Oscillator is in the neutral zone, the% K line is above the% D line, which indicates bullish moods.
Trading recommendations
Support levels: 107.500, 107.100, 106.800
Resistance levels: 107.850, 108.100, 108.500
If the price consolidates below 107.500, a further fall in the USD / JPY quotes is expected. The potential movement to 107.200-107.000.
An alternative could be the growth of the USD / JPY currency pair to 108.100-108.300


