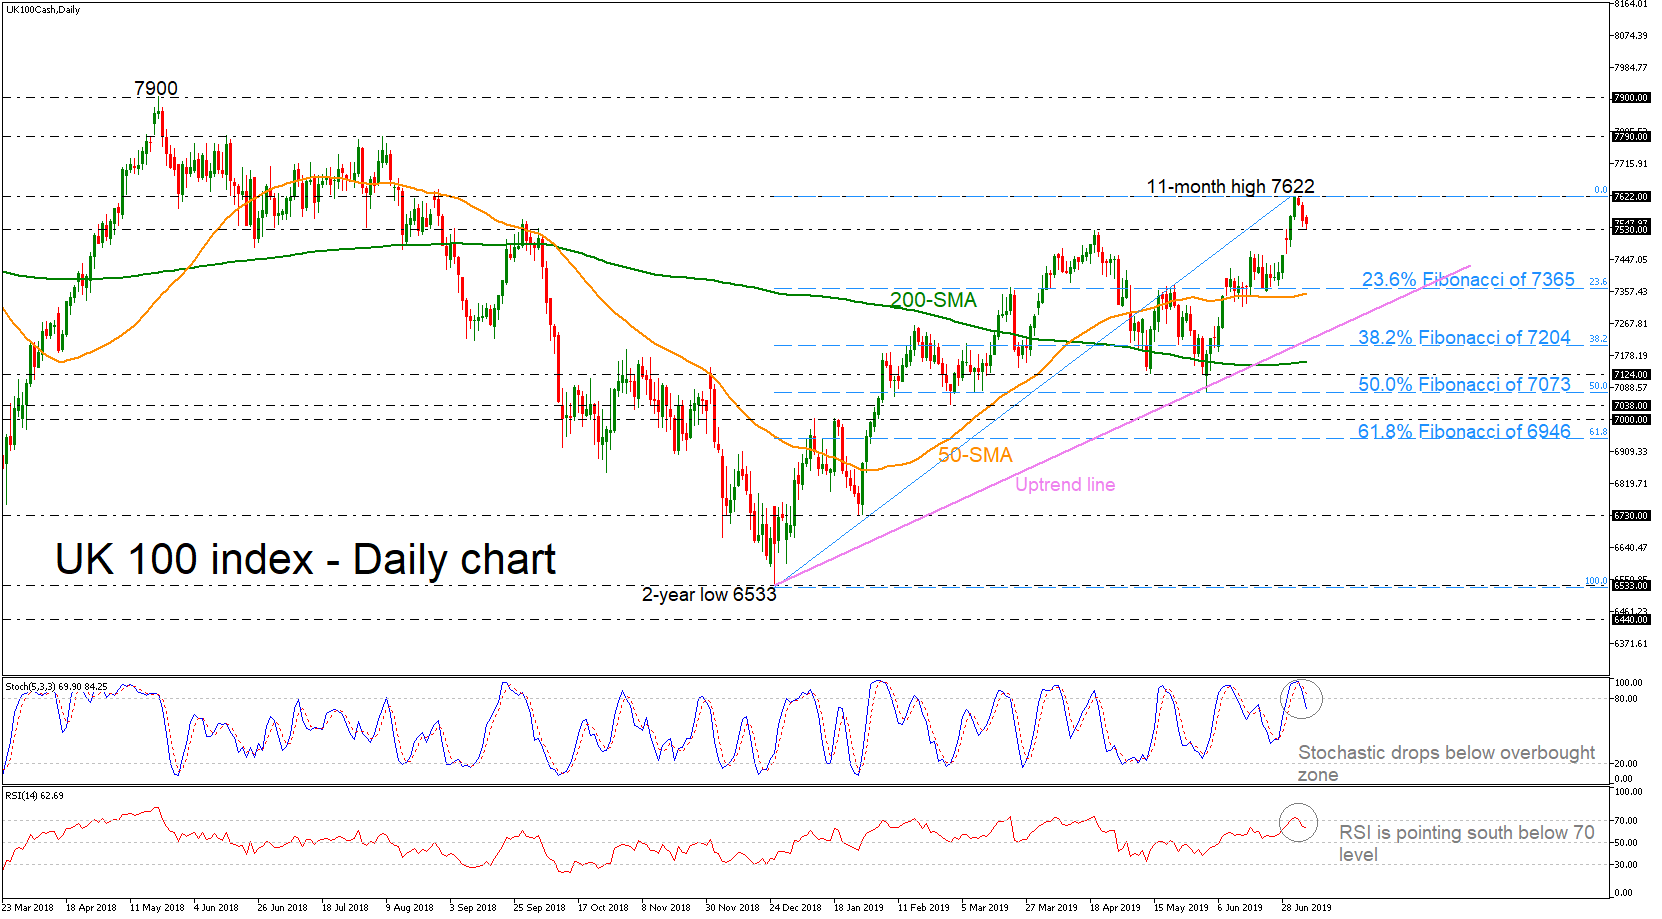
The UK 100 stock index (FTSE 100) has advanced considerably towards a fresh 11-month high of 7622, however, during the last couple of days is retreating, testing the 7530 support level. The stochastic oscillator is confirming this short-term view, as it is heading south below the overbought territory. Also, the RSI is pointing down following the bounce off the 70 level in the previous sessions.
In case of a bearish correction the market might revisit the 23.6% Fibonacci level of the upleg from 6533 to 7622 around 7365, which stands near the 50-day simple moving average (SMA). More declines could meet the 38.2% Fibonacci of 7204, around the long-term ascending trend line.
In the alternative scenario, if the price manages to extend the bullish action and surpasses successfully the 11-month high, resistance would come from the 7790 barrier, taken from the high on August 2018. Further up, the index could rest around the 7900 resistance area, identified by the high on May 2018.
Overall, a jump above the recent multi-month high could confirm the near-term bullish tendency in the daily chart.