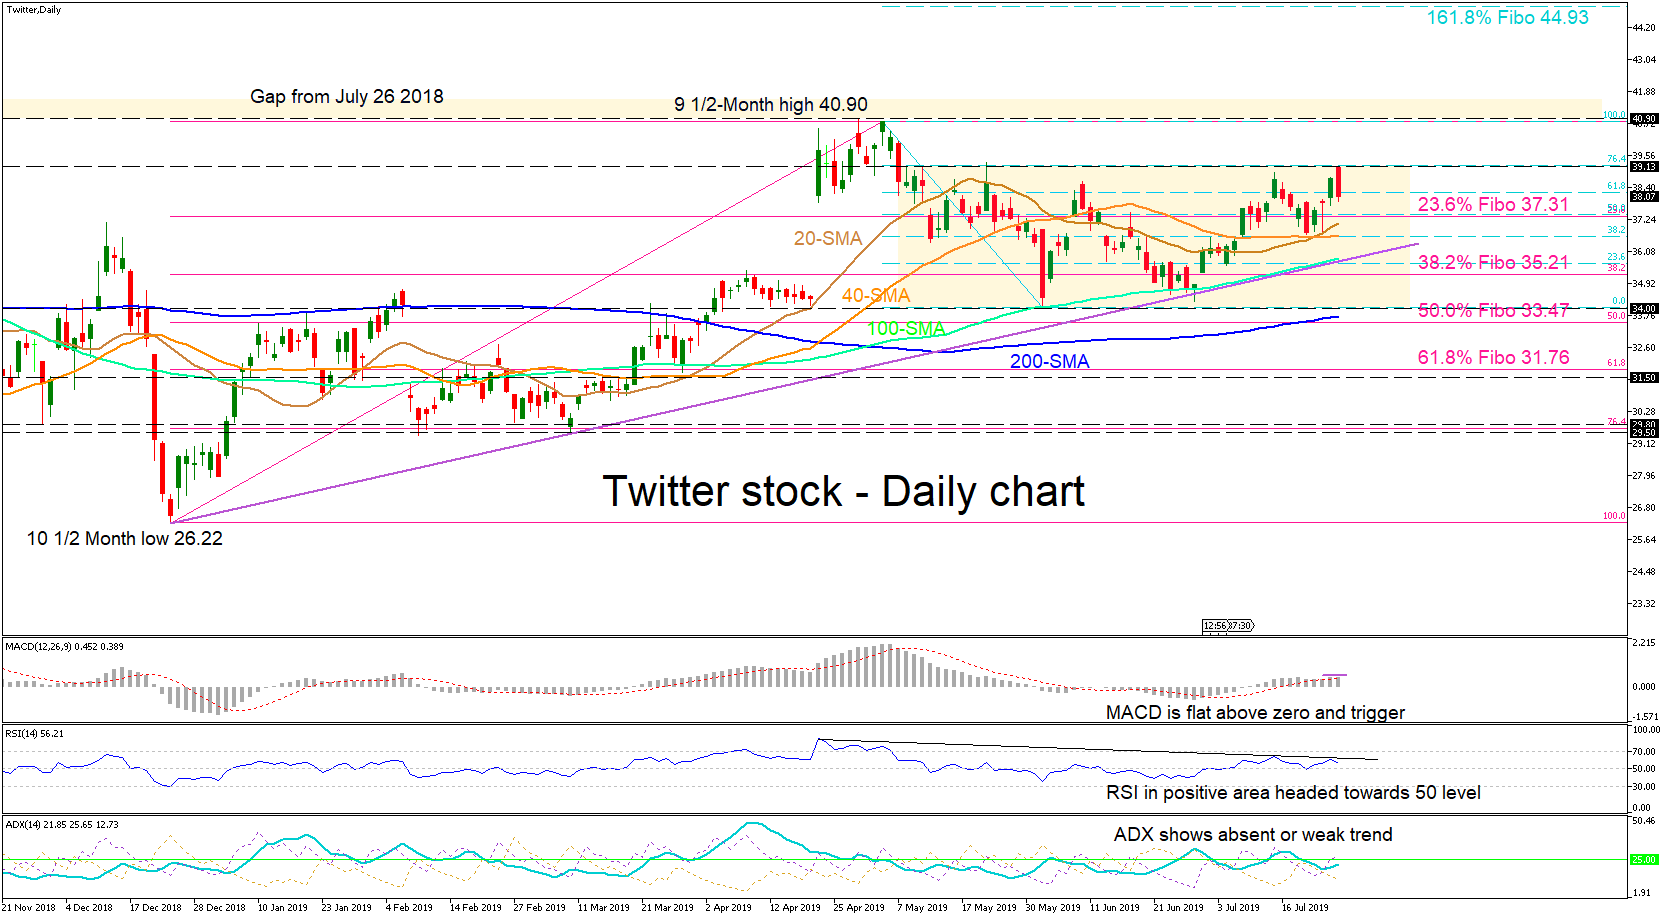
Twitter stock lunged up out of a trading range that lasted around nine months, trying to fill the gap from July 26 of 2018. The move had price hit a nine-and-a-half month high of 40.90 to only fall back into a two-and-a half month sideways market, where the price is currently shaking hands with the upper boundary.
Price has printed a red candle, besides a bullish cross up of the 40-day simple moving average (SMA) by the 20-day SMA. Helping the move up is the 100-SMA currently moving parallel with the uptrend line. The MACD, although above its trigger, is flat, whereas the RSI is in the positive area slightly pointing to neutral areas. The ADX shows a missing trend.
With an upwards scenario, initially price would retreat to the 23.6% Fibonacci of the up-leg from 26.22 to 40.90, of 37.31, before finding the 20- and 40-day SMAs. It may pull back even further to test the 100-SMA coupled with the uptrend line, before it violates the upper boundary of 39.13 to test the high of 40.90. If fractured and the gap is filled, a 161.8% Fibo of the down move from 40.90 to 34, of 44.93 could unfold.
Negatively, a lot of congestion is within the range.
Summarizing, the short-term view seems neutral to bullish, whereas traders need to be cautious of a break below 34 and the near 200-SMA to turn the bias bearish.